Note: This blog post was originally written for the Practice Vital website, you can find that original post here.
Interested in Practice Vital? Join via this link and code (below) and you'll get a small discount upon signing up.
https://www.practicevital.com/?ref=NH-TW2P
Code: NH-TW2P
Wine and cheese, ice cream and summer, bourbon and barbeque. All rockstar pairings. What about PracticeVital and financial decision making in your practice? These two utilized together can be an even more powerful pairing for you and for your practice, yes, even more powerful than ice cream.
PracticeVital is a super powerful tool for you and your practice. It allows you to see the real-time performance metrics for your therapy team at a glance in a visual, easy to digest format.
To level up this powerful tool even more, let’s take a look at how we can pair PracticeVital data and visuals with financial data and tools to create real actionable, tactical decisions to move your practice from point A to point B.
For each of the four sections in this article, we’re going to pair a PracticeVital dashboard or chart with a financial report or tool you can use to make real actionable, tactical financial decisions in your practice that will move you towards increased profitability and financial health.
Pairing #1: Pair the Practice Dashboard with your Profit & Loss
Tactical Decision: How many visits/clinicians do we need to reach our revenue and profitability goals?
The first pairing is a great one to start with as it will bring your vision and goals into a reality that you can plan for while looking at the “big picture”.
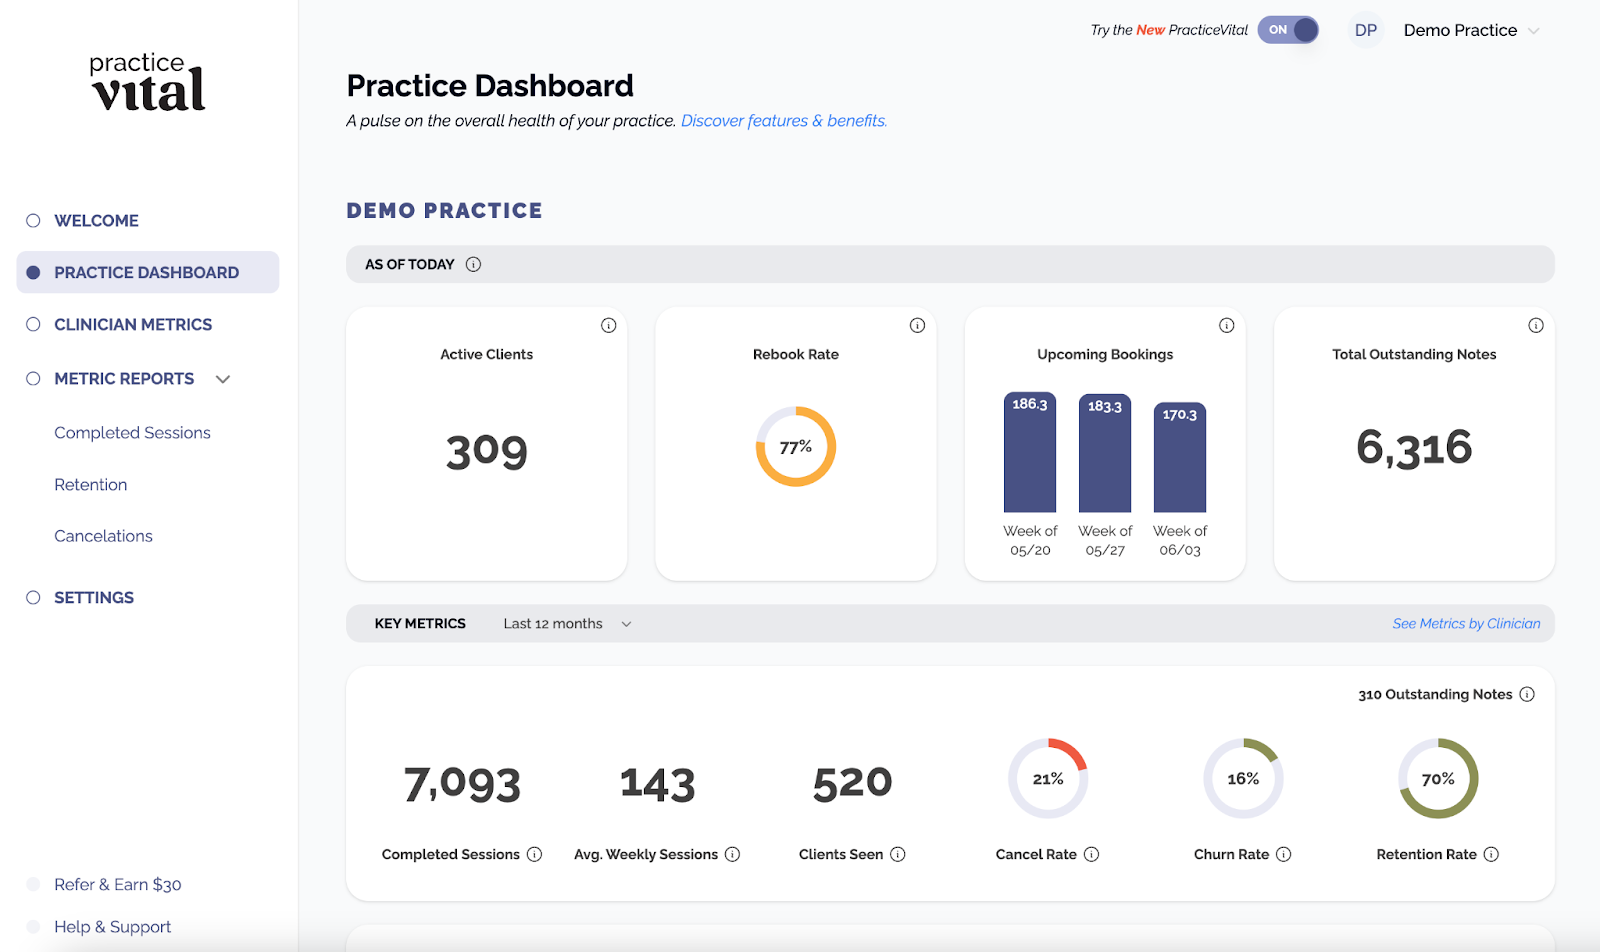
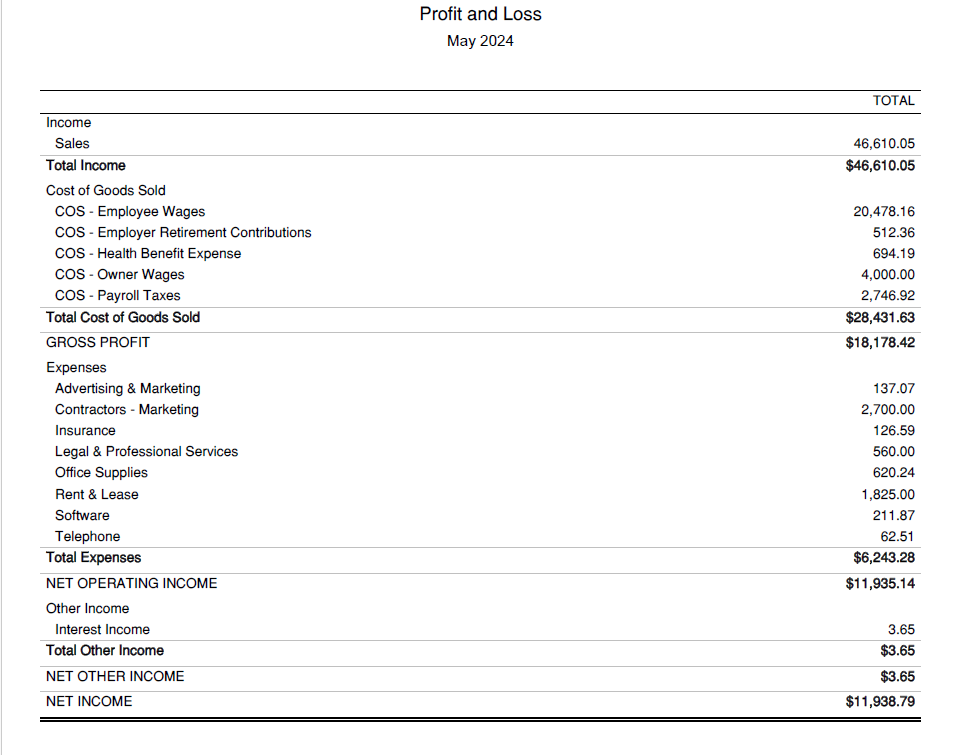
The PracticeVital Practice Dashboard gives a great overview of your practice’s overall health when it comes to sessions, clients, and upcoming sessions. In a similar way the Profit & Loss for your practice gives you an overall picture of your practice’s financial health. How these tools can be paired together comes down to turning “pie in the sky” goals you have related to revenue and profit into actionable steps related to sessions and capacity.
Let’s start with an example. We’ll create a hypothetical practice called Navigator Counseling. The goal for Navigator Counseling is $1,000,000 in revenue in a year. It sounds like a great goal but as the practice owner, what steps need to be taken to actually make that $1,000,000 possible in the practice?
Let’s take a look at Navigator Counseling’s Profit & Loss. We see that they’re averaging around $75,000/month in revenue. That should come out to $900,000 for the year, meaning that this practice will be $100,000 short on their revenue goal for the year. That sounds like an insurmountable goal! Let’s use the Practice Dashboard to make an actionable step.
We can see on the dashboard that in a month the practice is averaging 133 sessions per week. If we know that the average rate of reimbursement for the practice is $125/session, we can then figure out how many more sessions are needed to get to our revenue goal. In this case, since we need an additional $8,333/month in revenue to reach our goal, we would need around 15 more visits per week to reach our revenue goal. That’s attainable and would be the equivalent of one part time therapist! This type of decision making can be helpful in even considering how many more therapists and/or sessions are needed to reach practice goals.
We could use this pairing in the same way to tease out a profitability goal (which is usually even more valuable than a top-line revenue goal).
Using these dual high level views into your practice gives you the big picture of your practice’s financial health and performance metric health. This then allows you to see the actionable steps to take to move your practice towards the revenue and profit goals you want to hit. They will also allow you to get a solid picture of the financial health of your practice as any changes you see on the PracticeVital dashboard from month to month will also be reflected on the Profit & Loss.
Pairing #2: Pair the Clinician Metrics Overview Dashboard with the Clinician Profitability Tool

Tactical Decision: Which “levers” can we pull to help our clinicians get to at least 20% profitability?
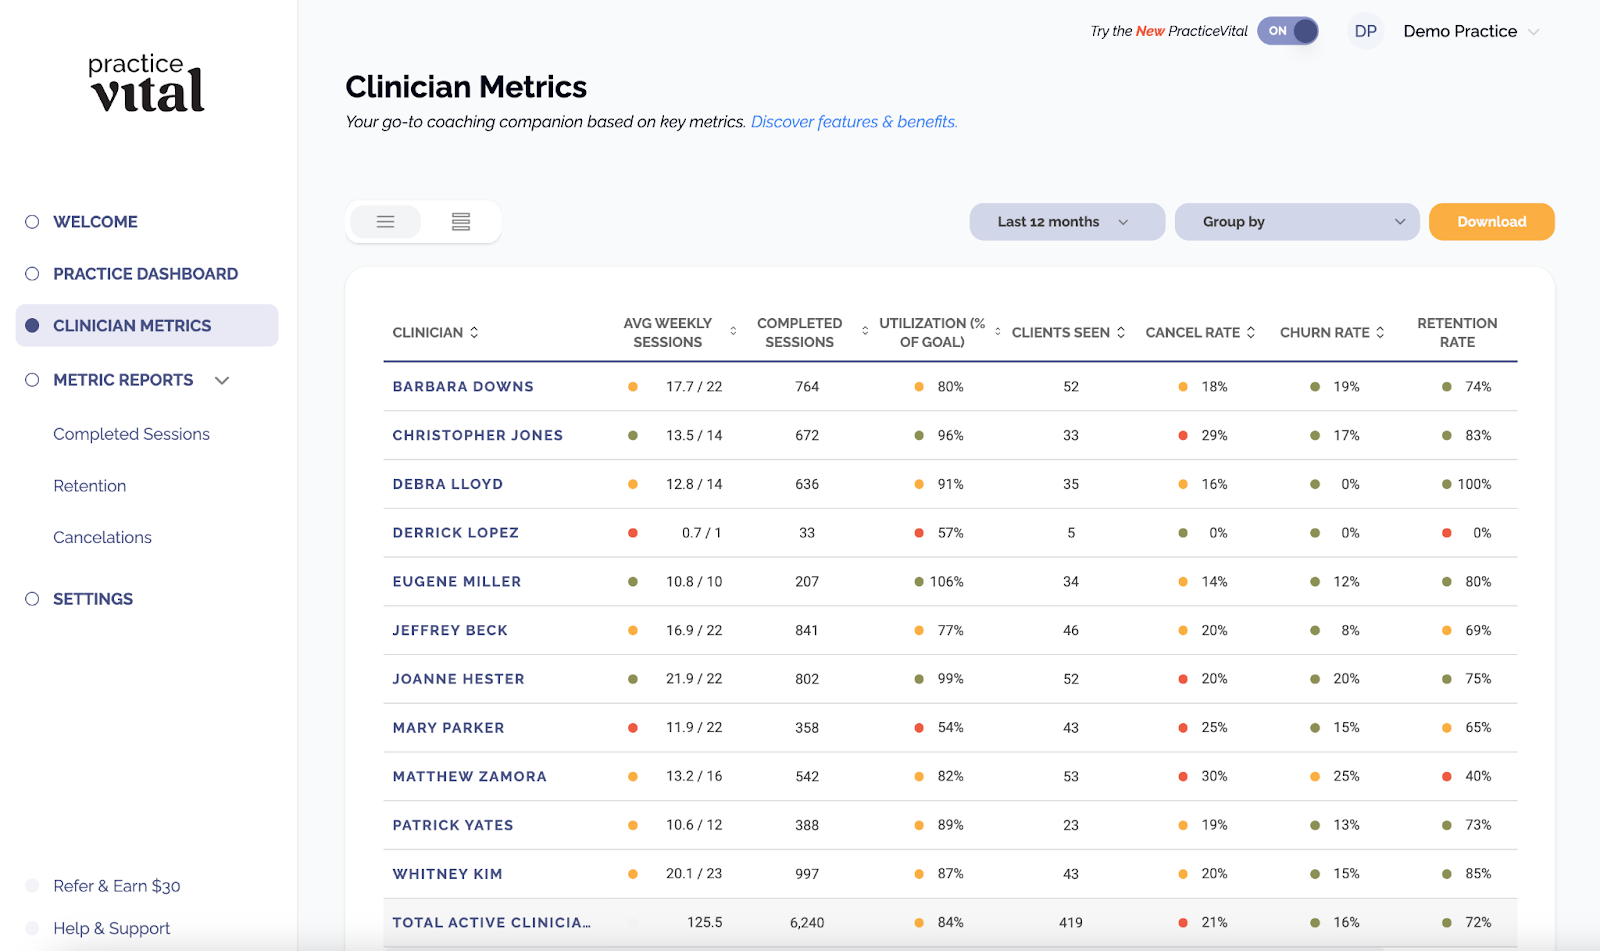
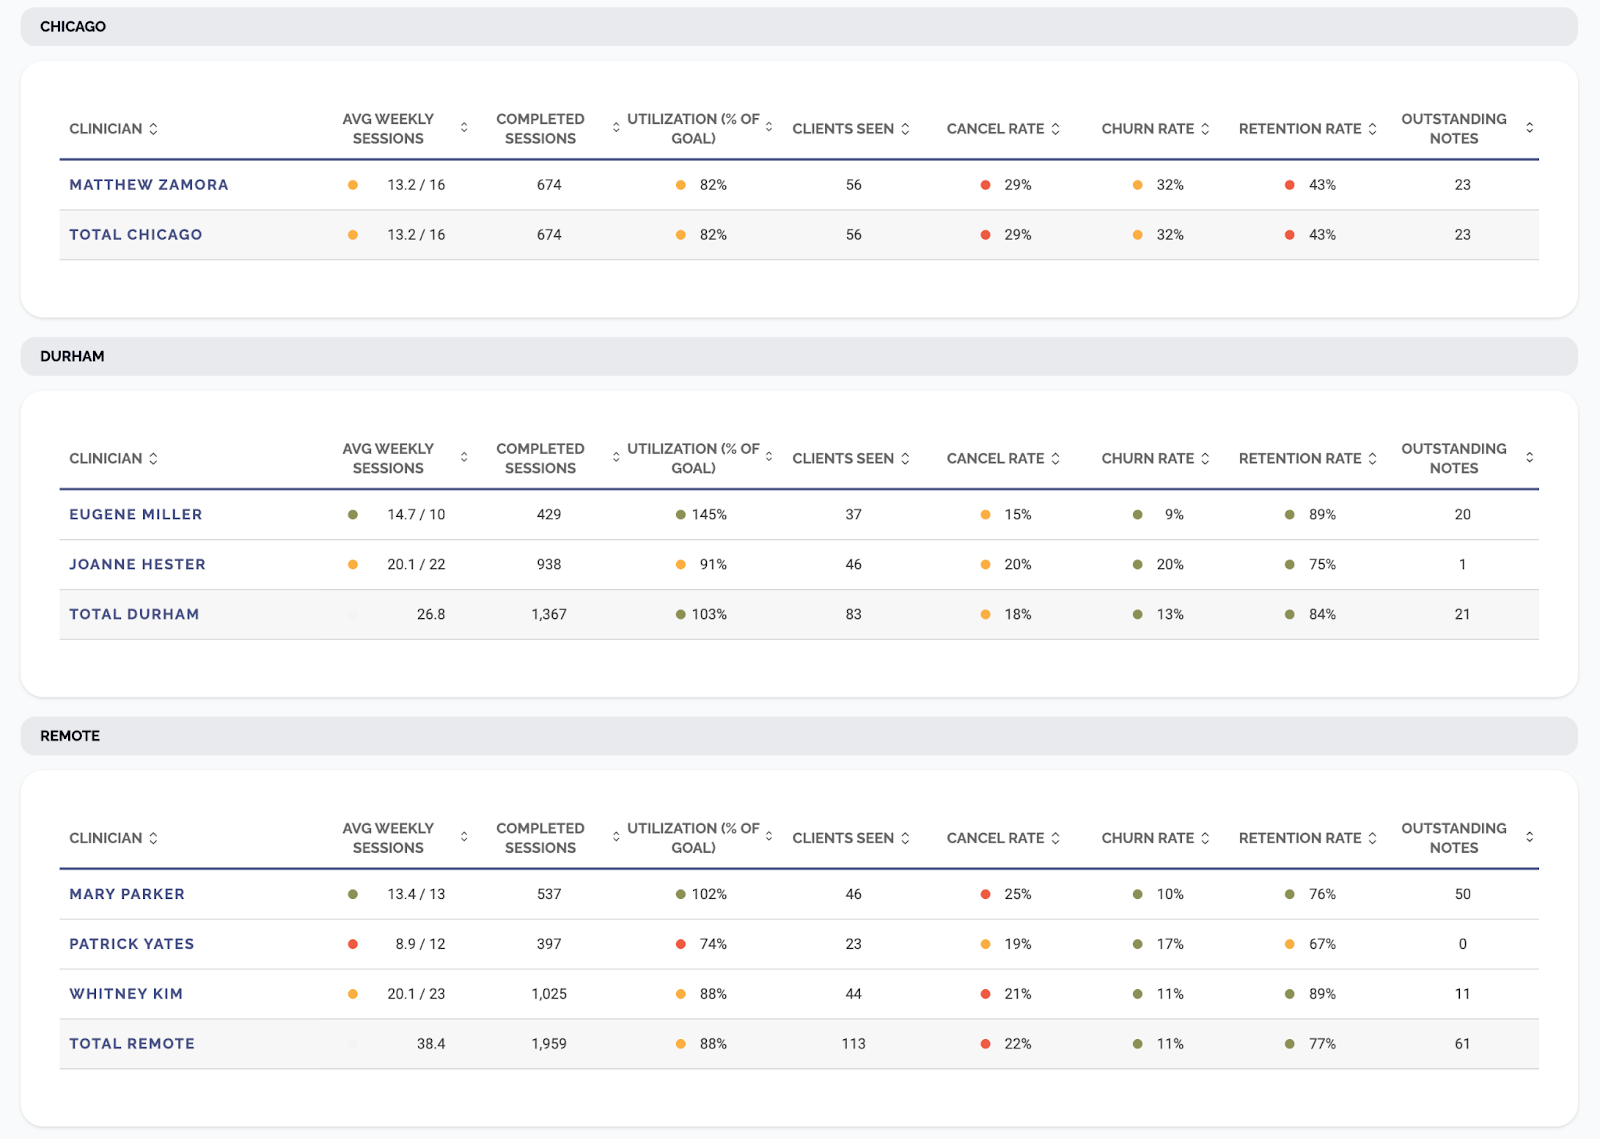
This second pairing takes your practice from the high level view to an individual clinician view. We’ll be pairing the PracticeVital Clinician Metrics Overview with the Clinician Profitability Tool. Similar to the first pairing, these tools actually show very similar data, but they show it very differently. The PracticeVital Clinician Metrics Overview is focused on capacity, sessions and retention. The Clinician Profitability Tool is focused on revenue, expenses, and profit. These are two sides of the same coin.
The tactical decision in this pairing comes down to taking steps to have as many of the practice’s therapists as possible at a 20% profit margin. This is a general benchmark of ideal clinician profitability. Some clinicians will be much higher, some may be lower depending on capacity and pay structure. That being said, the 20% is the average each practice should look to at least achieve.
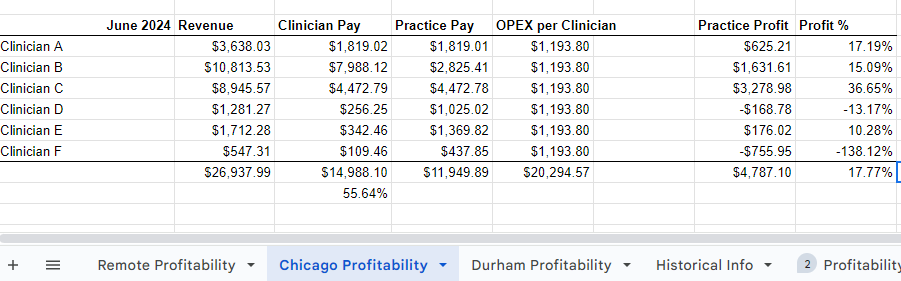
Starting with the PracticeVital Clinician Metrics Overview, we’ll pull the completed sessions for each clinician for a month and input that into our clinician profitability tool. Once the clinician profitability tool’s other columns are filled in with the monthly data (tutorial on how to do that here), we can then use these visits to consider what needs to change for each clinician to get them to the 20% benchmark. This can be a decision with many possible options. For example, if a clinician is below the 20% benchmark, it could be their pay structure is too generous (a 65% commission split vs a 58% commission split for example), or, it could be that their capacity is too low to reach profitability. These tools paired together will help us diagnose the issue.
By exploring the PracticeVital Clinician Metrics Overview we can view action items for the clinician that may need to be worked on such as churn rate and capacity. By exploring the clinician profitability tool, we can view action items on the practice side that may need to change to reach peak profitability such as pay structures, overly high operating expense spending and the like. By viewing both these together, we see the complete view of profitability, both the clinician and the practice side of the equation.
For many practices it would be a best practice to review these tools together each month, looking specifically for any clinicians below the 20% profit margin and then zeroing in on both reports to determine what may be needed to help these clinicians reach the 20% benchmark.
Pairing #3: Pair the Clinician Metric Details Dashboard with the Sandbox Clinician Profitability

Tactical Decision: Create pay structures and bonus/incentives structures to maximize capacity and productivity while also compensating team members fairly and ethically.
The third pairing can connect to the second pairing in that they’re both centered around clinician and/or leadership pay. The difference is that this pairing dives into creating potential incentives, bonuses, or pay structures to reward clinicians, keep retention high, and keep clinicians accountable to practice benchmarks when it comes to retention, capacity, and sessions in a period of time.
There are almost countless structures to consider when planning how to pay or incentivize your clinicians. From commission splits with multiple tiers, to salary + commission hybrids, to hourly rates with multiple rates baked in, there’s many options to choose from. One common thread through many practice pay structures is the option to incentivize or bonus out employees based on performance. This is a powerful option to consider since the main issue behind many practice’s lack of profitability is a lack of clinician revenue and capacity. By building out incentive or bonus structures, practice owners reward team members for reaching goals, while also continuing to scale their practice growth and profitability.
Combining PracticeVital’s Clinician Metrics with a Sandbox Clinician Profitability Tool we can both forecast how these pay structures will work and easily track clinician performance to both administer incentives and bonuses while also quickly flagging performance, both positive and negative.
Let’s look at how these could work together. Let’s say our practice, Navigator Counseling has two different therapists they’re both looking to implement incentive structures for. One therapist is a high earner, one is a bit of a lower performer, but both are quality clinicians.
Using the sandbox profitability, which is a version of the clinician profitability tool that we can use to “play” around with numbers and forecast with, we can first create two pay structures to incentivize these two very different therapists.
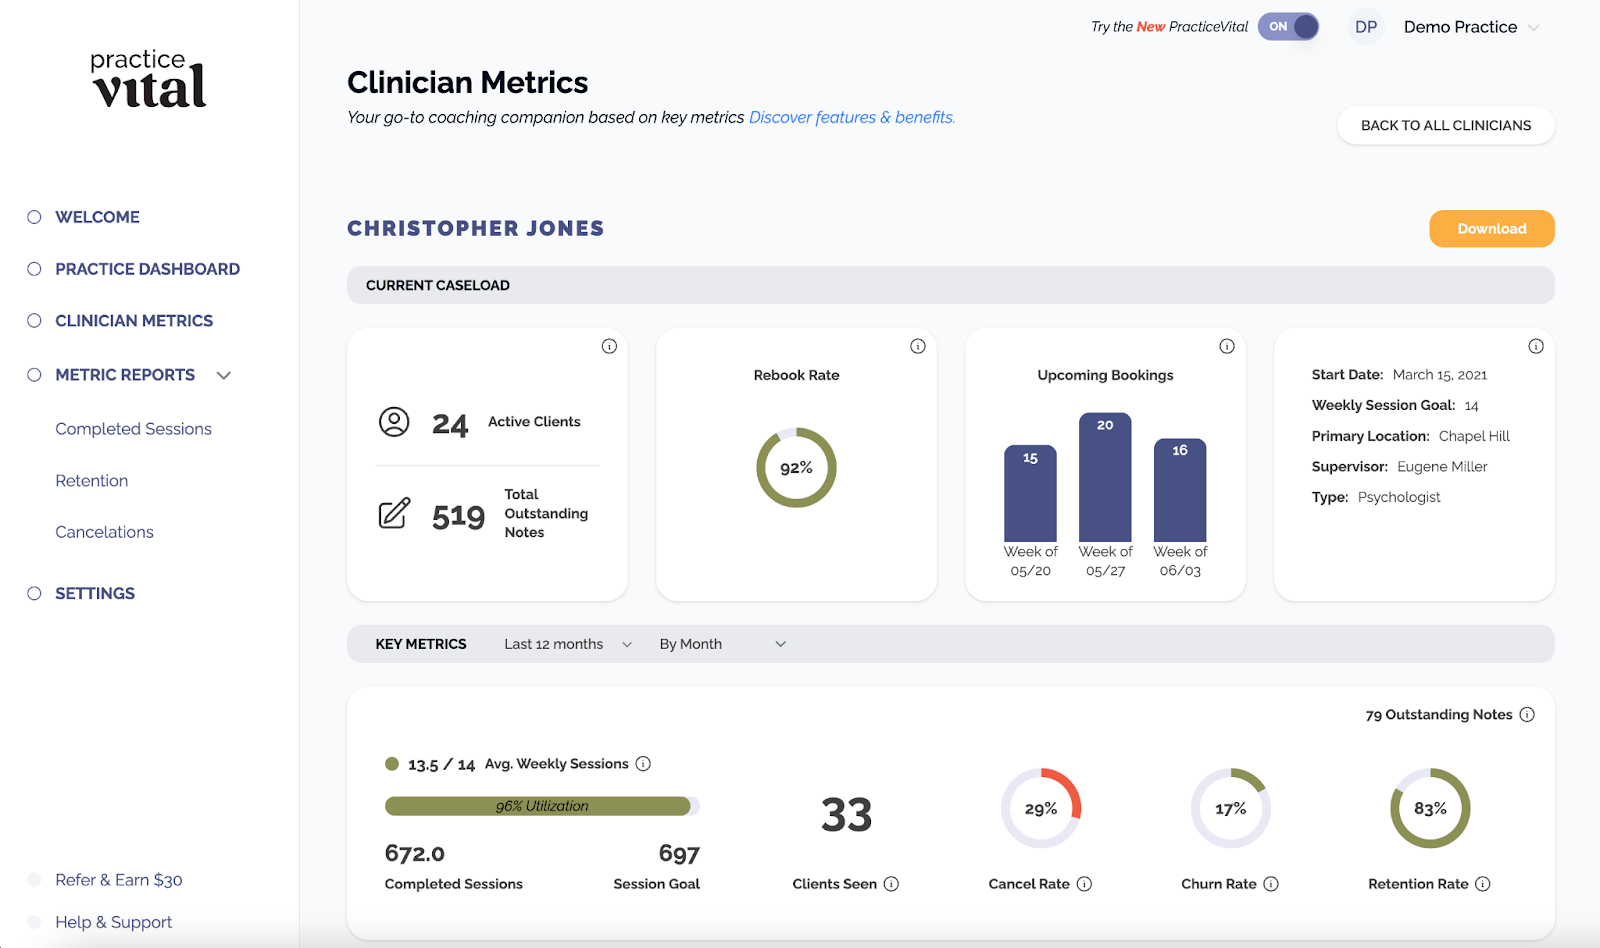
Starting with the low performer, the pay structure could pay out a monthly bonus based on reaching a specific capacity or retention goal while lowering the clinician’s overall base commission split or hourly rate. Using the sandbox, we can plan for how high of a bonus we want to give, in order to keep this clinician profitable, while still providing enough of an incentive. Once the structure is created and we can be confident it is profitable, we can then track this clinician’s retention goal (and share this data with the clinician to give them ownership over the goal) using PracticeVital’s Clinician Metrics by Month.
With the high performer, the goal is to retain this clinician and reward them for their work. With that goal in mind, the practice may be willing to lower it’s profit margin on a portion of this clinician’s revenue, in order to pay them well and retain them. Using the sandbox, we can create a tiered structure of commission split, allowing the clinician a higher portion of the split the higher their monthly revenue (or number of visits) is. Once we’re pleased with the profitability of this structure, we can then use PracticeVital’s Clinician Metrics to easily follow and record the clinician’s weekly and monthly visits in order to pay them correctly based on their performance.
These are two simple examples of how these tools could be paired together to first plan and then hold clinicians accountable to incentive or bonus structures, while also cutting down on the admin work necessary for the practice owner, or, admin team. There are many more possibilities, hybrids, or bonuses available based on performance. With all of these, a best practice is to make this data easily accessible to the leadership team and the clinician in question, to allow ownership and mutual support throughout the incentive program.
Pairing #4 - Optional: Pair Location Profitability View with Location Profitability Sheet
Tactical Decision: What is the breakeven point for new locations and how do we reach that point?
Using the above pairings, Navigator Counseling is now confident in its overall profitability and goals, confident in its individual clinician pay structures for existing and new employees, and has implemented incentive and bonus structures to help clinicians reach their goals, maximize capacity, and be retained by the practice.
We’re now ready to expand into multiple locations and continue scaling our business model. This is where the fourth pairing comes in. As practices expand and look to expand to new locations, the question arises as to what the “breakeven point” is for the new location. How much revenue is needed to meet costs? How many visits should the practice plan on achieving? What level of churn is acceptable as this new location starts up?
We’ll pair a location version of our clinician profitability (simply copying the clinician profitability tab into multiple tabs to create multiple locations) with PracticeVital’s Location Profitability. Using these two together we’ll first plan out our revenue and profitability goals to determine how many visits are needed to reach profitability at the new location. Then, using the Location Profitability inside of PracticeVital, we’ll track our sessions, churn and retention rates specifically by location to calculate our progress towards our goal. Another helpful use here is to compare a new location’s metrics with an existing location. New locations may have a more difficult time making traction on visits and capacity. By comparing these metrics, we can compare where the new location is strong and where it may need to improve.
This last pairing may seem familiar and related to some of the pairings above. That’s because the PracticeVital metrics and the financial data work together in a predictable and symbiotic way. The financial data can be used to forecast and plan while the PracticeVital metrics show clearly how performance relates to these plans and forecasts.
In many ways the two sets of data are two sides of the same coin. Sessions and revenue are closely related while churn, retention, and utilization all directly impact clinician profitability. Using these two data sources together creates a powerful understanding for the practice owner, all while showing them data in an easy-to-digest and visual format. The most unhelpful type of data is difficult to find, create, or manage. Using the sources of information above, practice owners and leadership teams will be able to easily view both sides of practice performance, both the clinician performance and financial performance.
Utilizing PracticeVital and financial data together to make tactical decisions may not be as fun or delicious as ice cream or bourbon. But this pairing will have a powerful impact on the decision making in your practice while also cutting down the time spent on finding and utilizing data. Data is only helpful when it’s used. When we pair PracticeVital with the financial tools above, we allow practice owners to feel confident in their performance and easily formulate a plan to keep moving their performance in the right direction. If they decide to sample some ice cream while doing so, they’ve really mastered the art of pairing.