
The Therapy Practice Benchmark Report
What the numbers really look like inside a mental-health group practice, drawn from the books of 95 practices we keep every month.
The short answer: in 2026, the typical small or medium therapy group practice earned a 14% net profit margin, paid 35% to 50% of revenue to clinicians, spent 28% to 41% on overhead, and paid the owner about 20% of revenue. Large practices with 11 or more clinicians ran thinner 5% margins on far more revenue. All figures are medians from the books of 95 mental-health practices.
This report is for reading. The charts, tables and boxes show the data and aren't clickable. Links, buttons and the chart downloads are the only things you can click. The one hands-on part is the calculator at the end, where you can try your own numbers.
2026 by the numbers
practices' books, closed every month by Navigator
typical profit margin for small and medium practices
typical margin for large practices, and that is normal
of revenue goes to clinician pay at a medium practice
overhead at a large practice, down from 51% when solo
typical owner's pay once revenue tops $1M
- Margins shrink as you grow, and that's healthy. Compare yourself to practices your size, never to a solo practice.
- Clinician pay is the biggest lever. It's the largest cost and it moves the most as you hire.
- Owners take a smaller share but more dollars as they grow. Check both the percentage and the dollar amount.
Jump to:1 · Find yourself2 · The big four3 · A closer look4 · Make it yoursReference
You're welcome to use any number or chart from this report in your own articles, talks and slides. Please credit Navigator Bookkeeping and link back to this page.
Navigator Bookkeeping, “The Therapy Practice Benchmark Report,” 2026 edition. https://navigatingyourbooks.com/therapy-practice-benchmark-report/
Free to use in your articles, slides and posts with credit to Navigator Bookkeeping. Each one opens full size.
Three questions place you in this report: your size, your payer mix, and how you pay clinicians. Then see the typical practice that looks like yours.
How to use this guide
If you have ever wondered whether your practice's numbers are “normal,” this guide is for you. It shows what the finances of a real mental-health group practice look like, so you can find your own situation and see how you compare.
Find your practice
Your size, your payer mix, and how you pay clinicians. These three things are all you need.
Go to your numbers
Each section shows a benchmark broken out by size. Find your row and read across.
Read the range
Inside the range means you are normal. Far outside it is a question worth asking, not a verdict.
What size is your practice?
Mostly insurance or private pay?
- Insurance · most revenue comes from insurance reimbursement
- Private pay · most revenue comes from clients paying out of pocket
How do you pay clinicians?
- Percentage split · a share of what they bill or collect (most common)
- Hourly rate · a set rate per session or hour
- Salary · a fixed salary (too rare to benchmark; observation only)
We are financial guides who work only with therapy practices, and we come from a teaching background, so we've written this the way we'd explain it across the table. Throughout, you'll meet Navigator Counseling, an example medium practice we use to show how to read each benchmark.
Therapy practice benchmarks by size: the four profiles
The fastest way to find yourself. Find your size column and read down.
| Median figures | Solo *1 clinician | Small2–5 | Medium6–10 | Large11+ |
|---|---|---|---|---|
| Typical annual revenue | $125,080 | $329,558 | $803,215 | $2,165,701 |
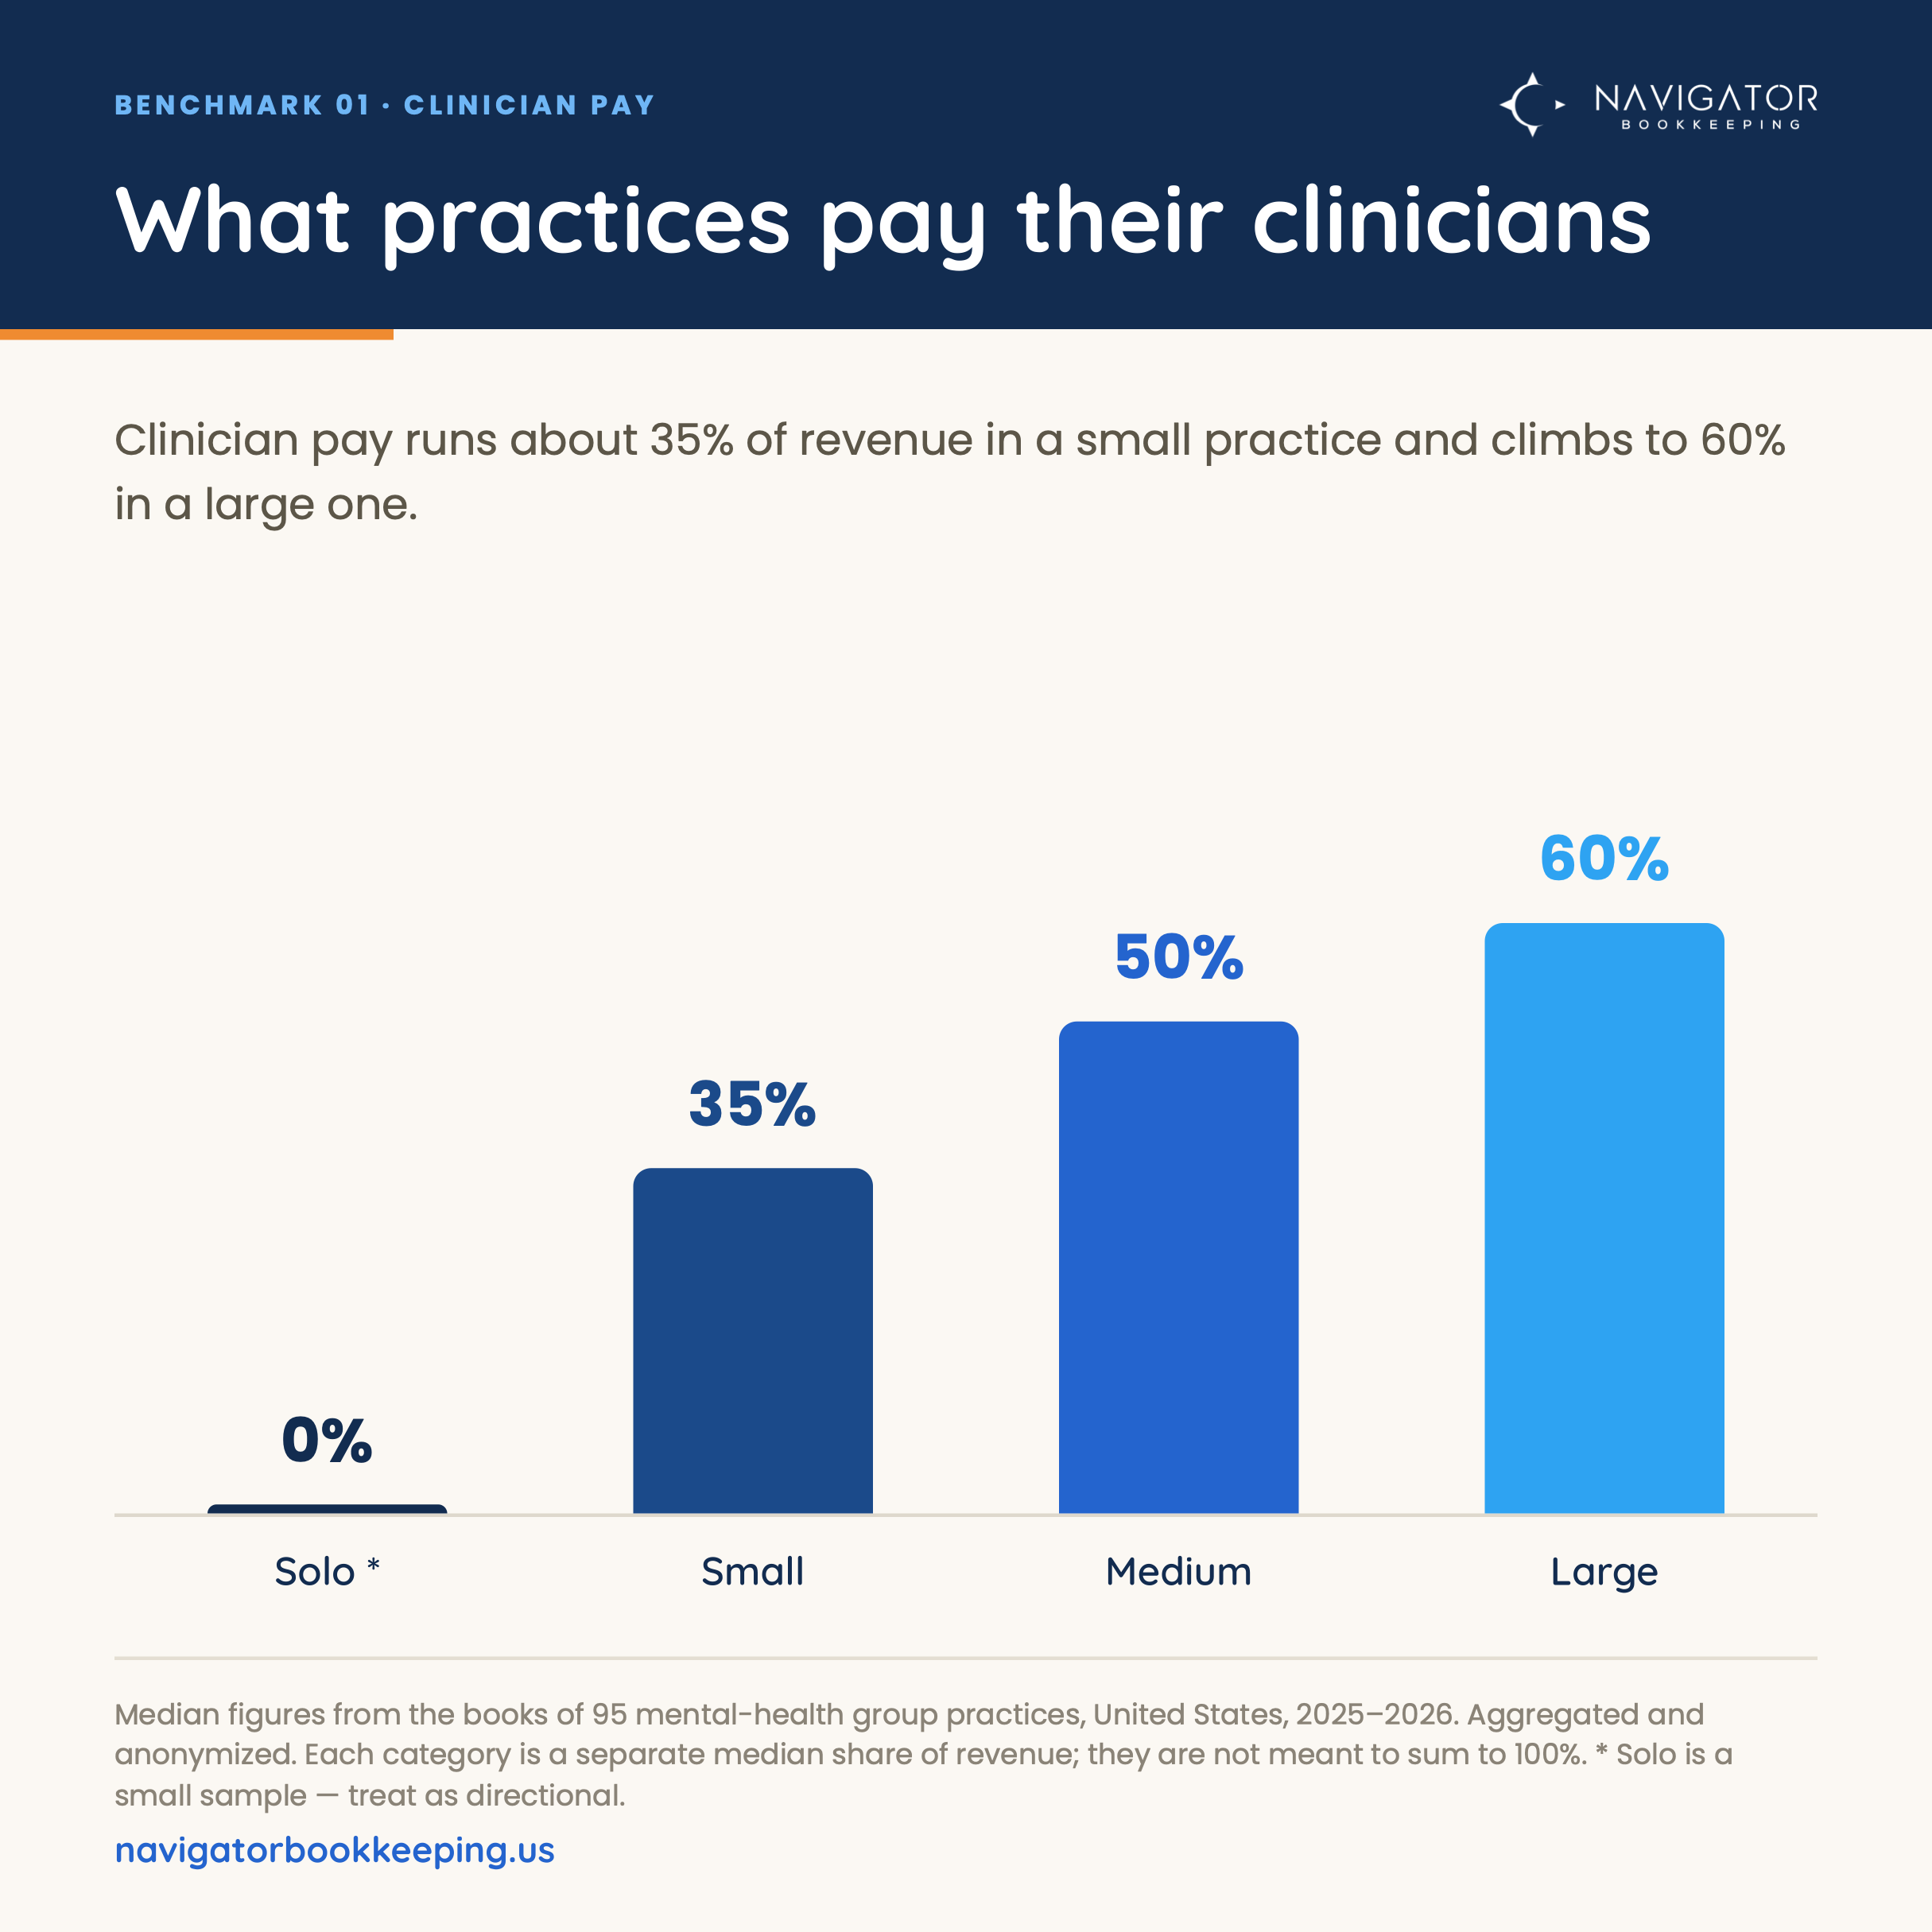
| Clinician pay | 0% | 35% | 50% | 60% |
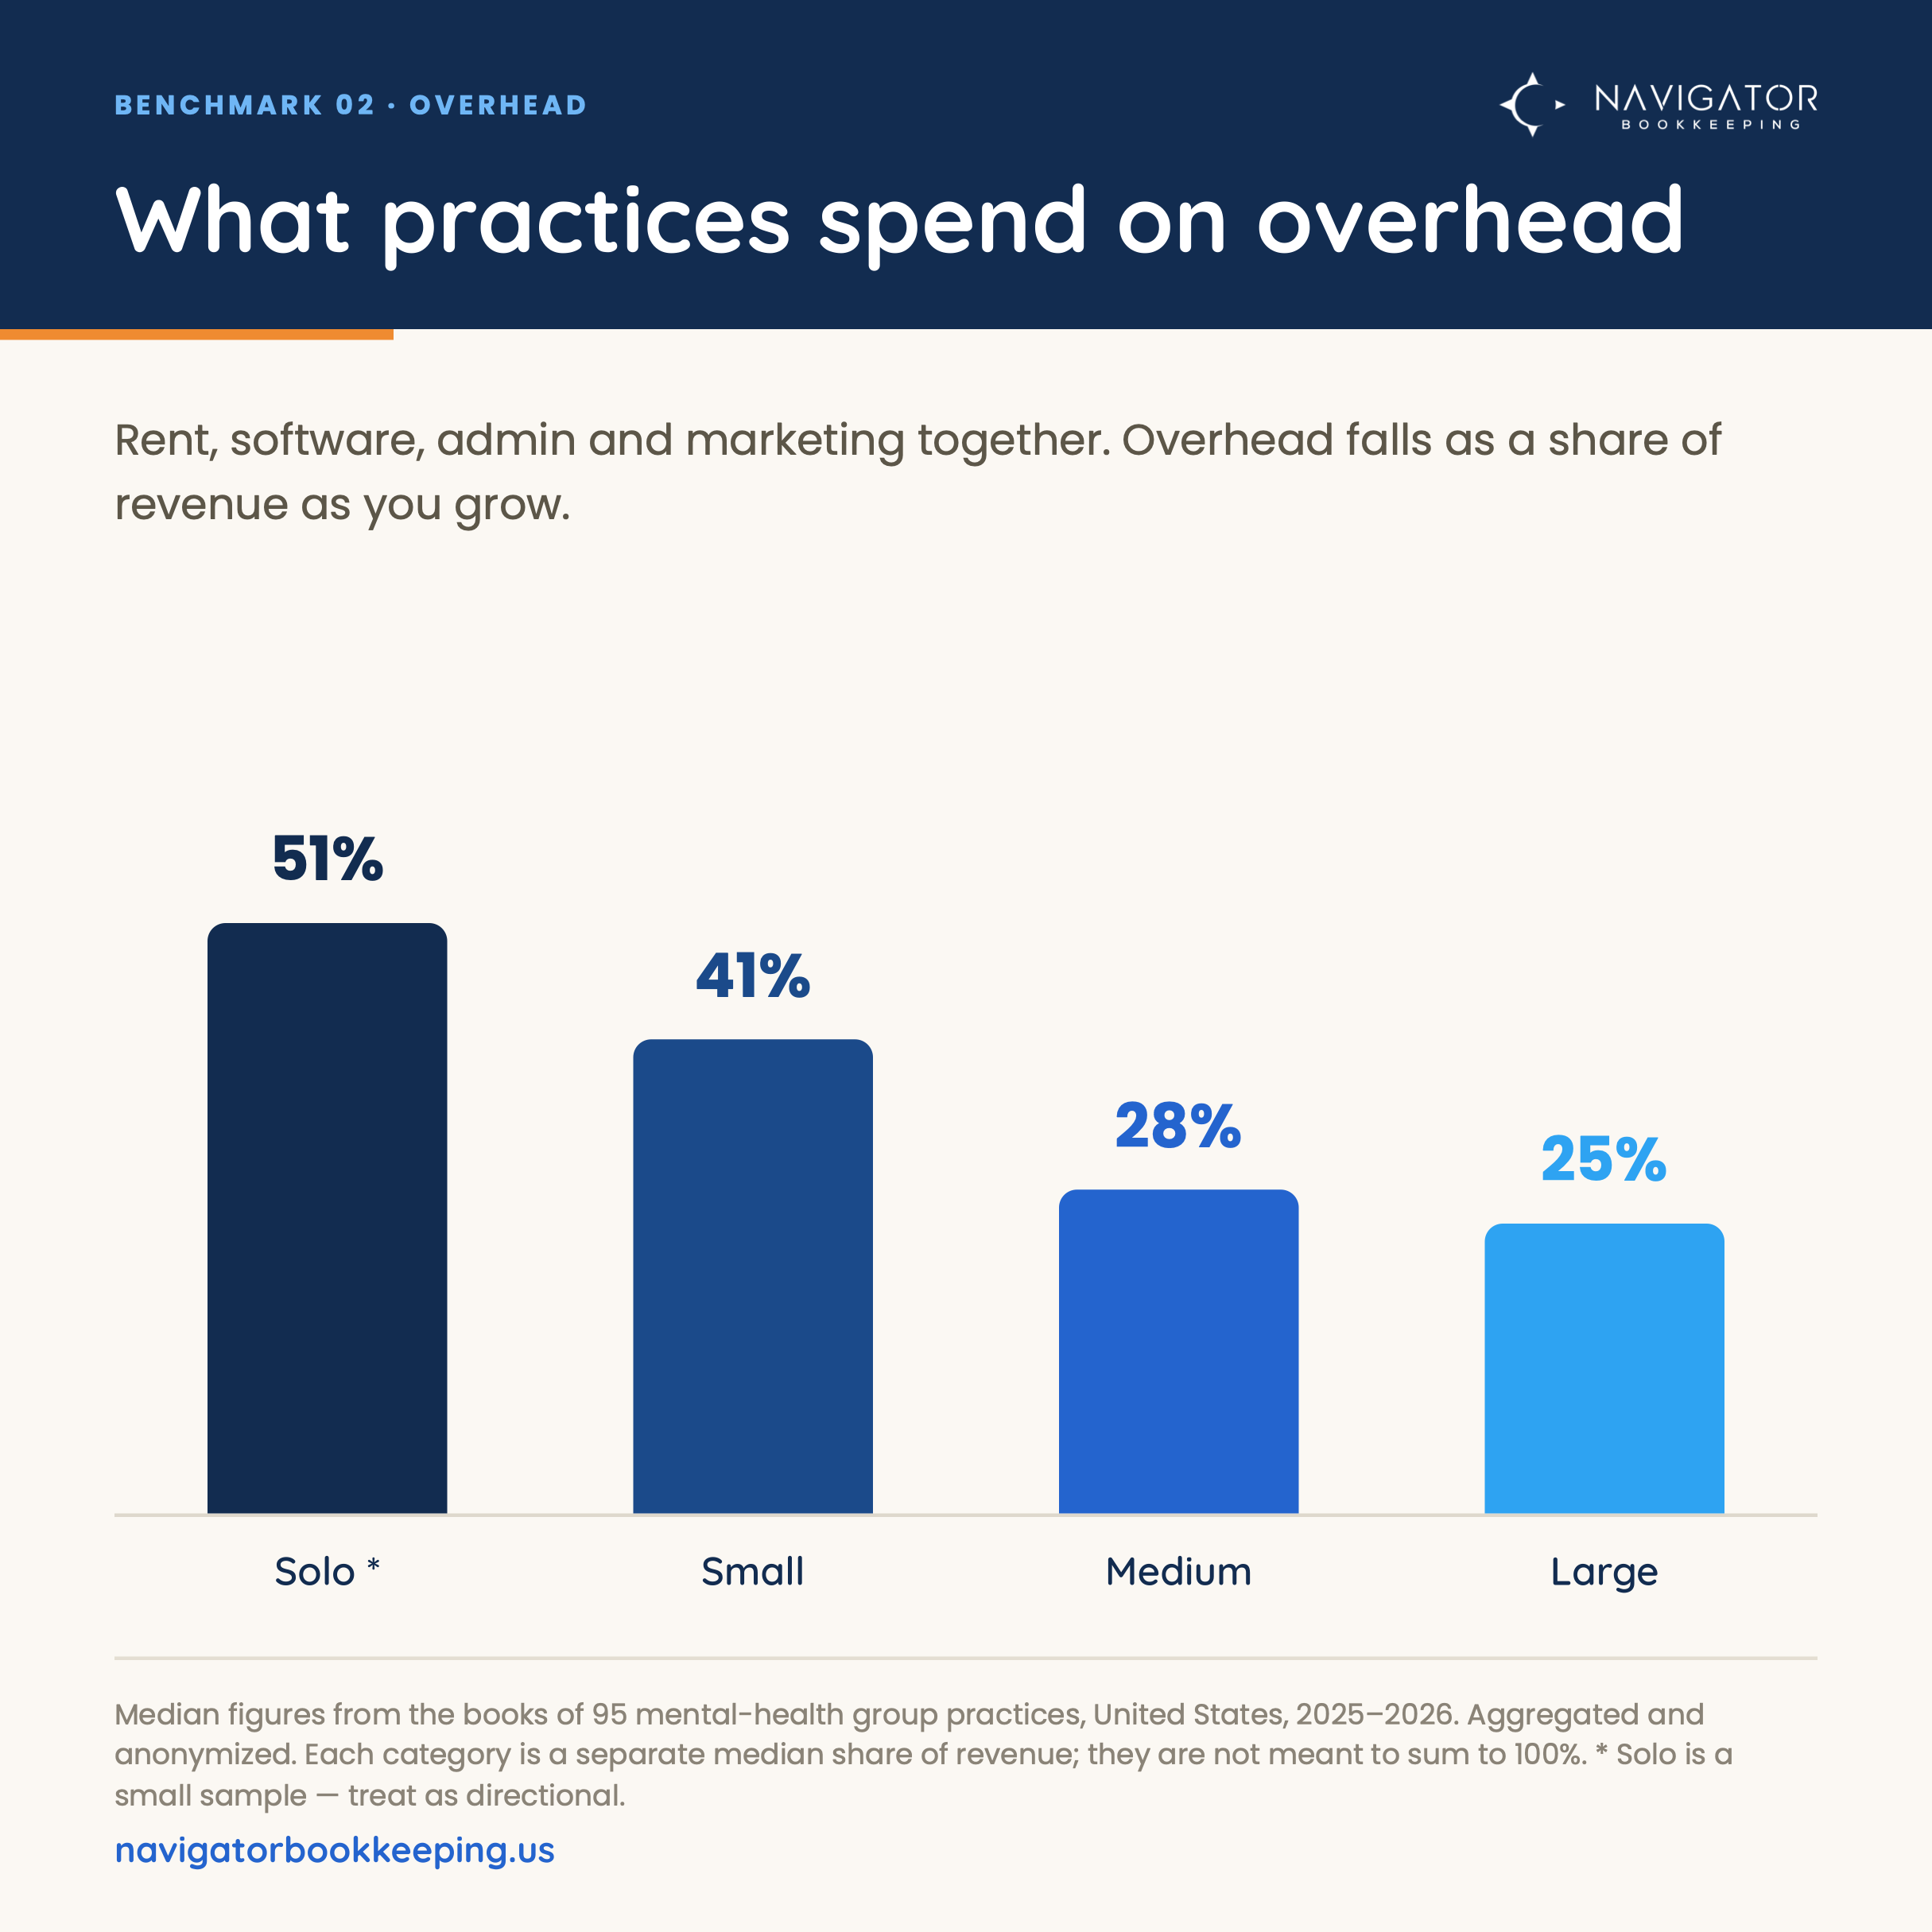
| Overhead | 51% | 41% | 28% | 25% |
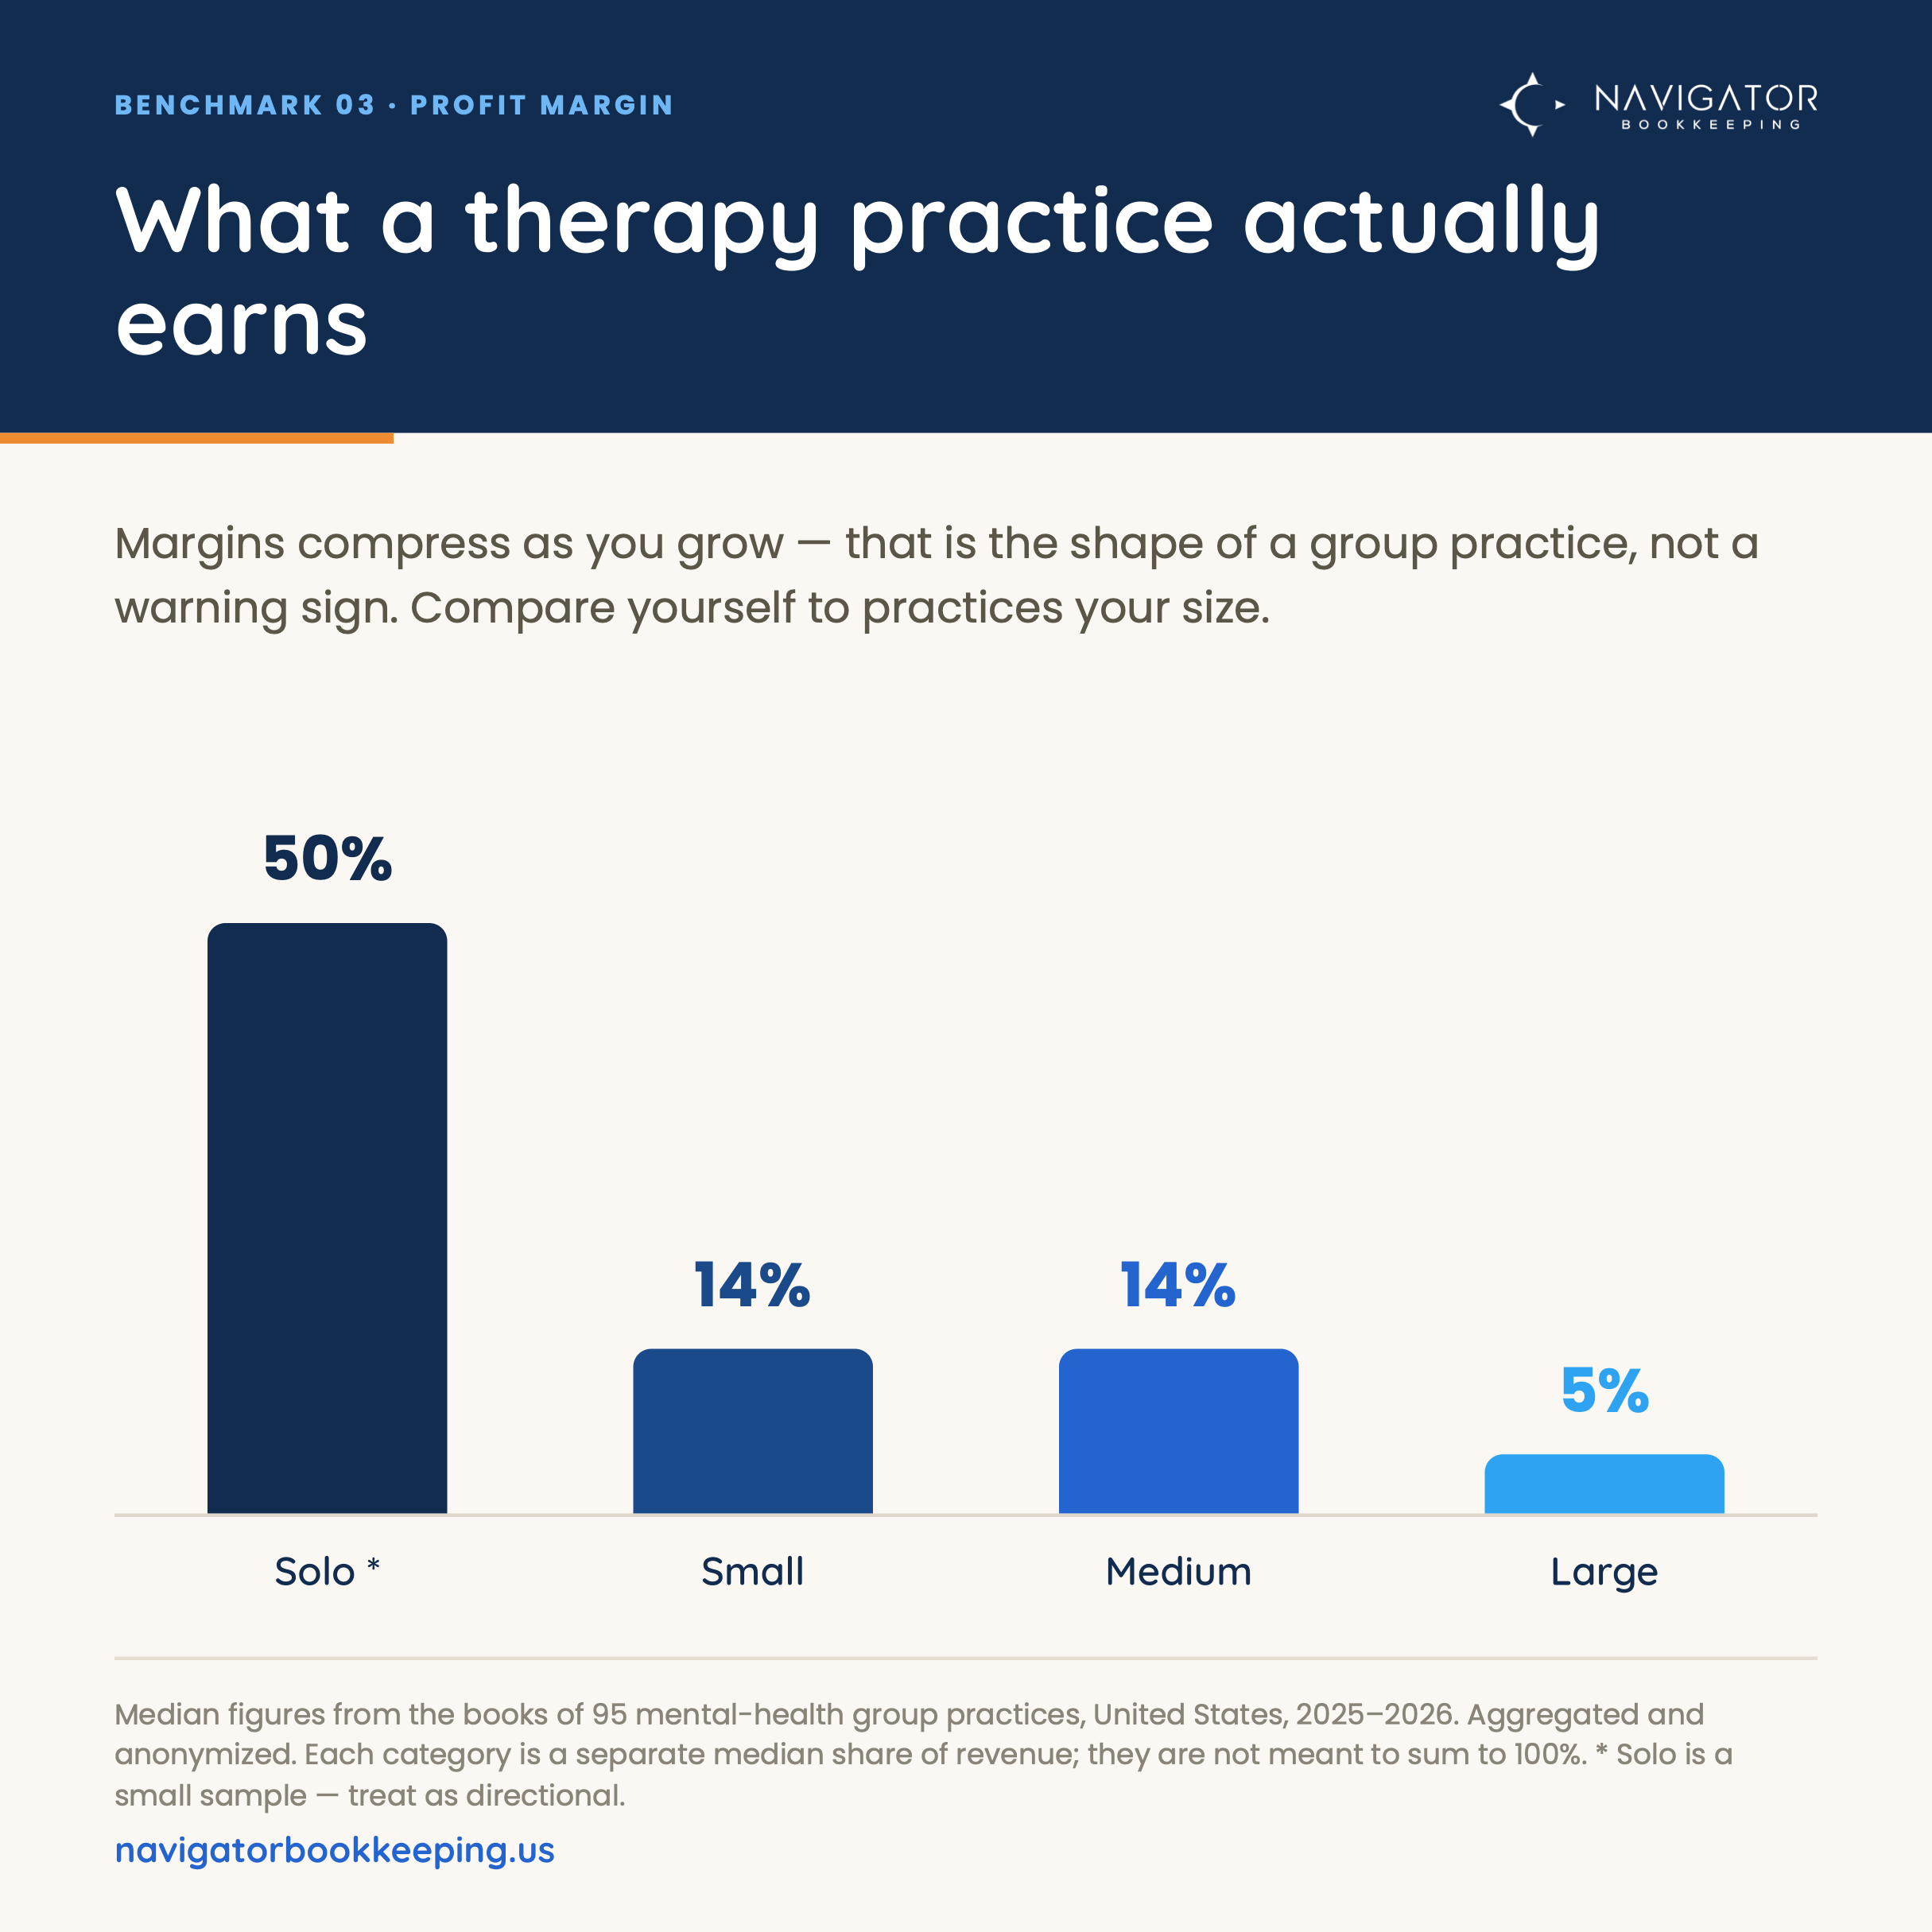
| Profit margin | 50% | 14% | 14% | 5% |
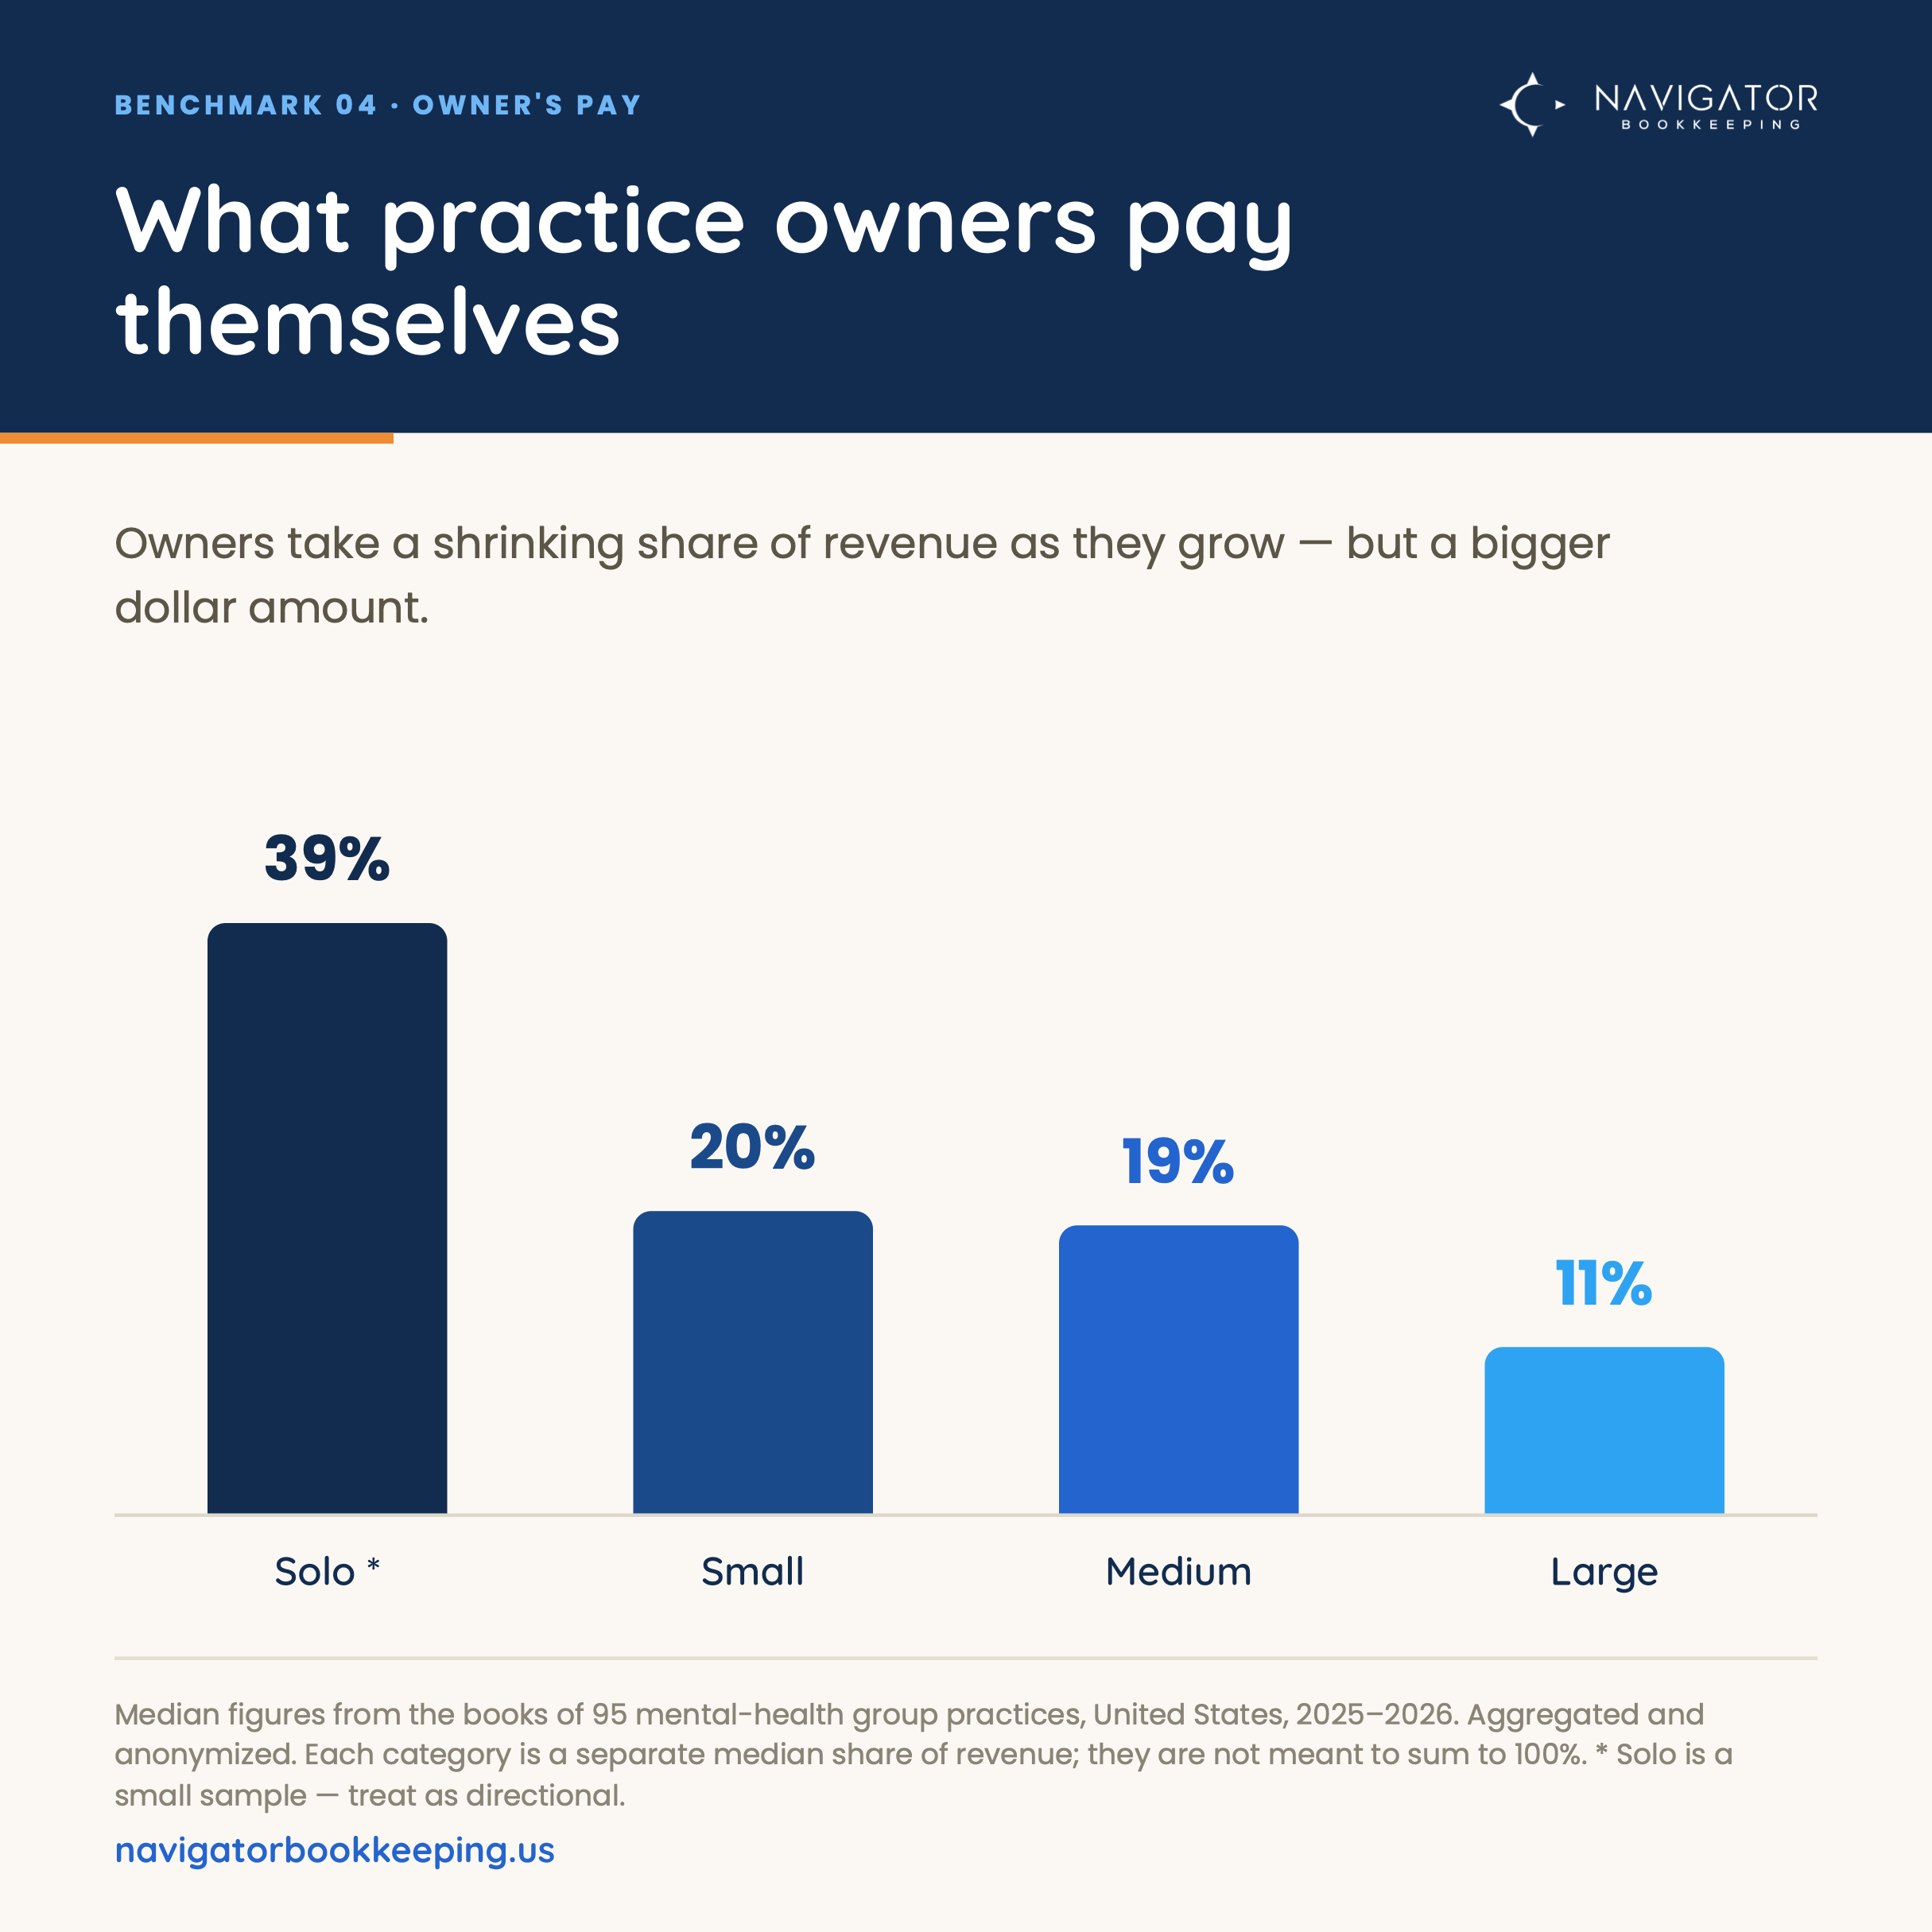
| Owner's pay | 39% | 20% | 19% | 11% |
Percentages are shares of revenue. * Solo is a small sample; treat as directional. Why a column doesn't add to 100%: each figure is the median for its own row, not one practice's books, and owner's pay is already counted inside overhead.
Clinician pay, overhead, profit margin and owner's pay. These four numbers tell you most of what you need to know about a practice's health.
How much do group practices pay clinicians?
In plain terms: cost of services is the money you pay your clinicians to see clients. Accountants also call it “cost of goods sold” or “COS.” It does not include your own pay.
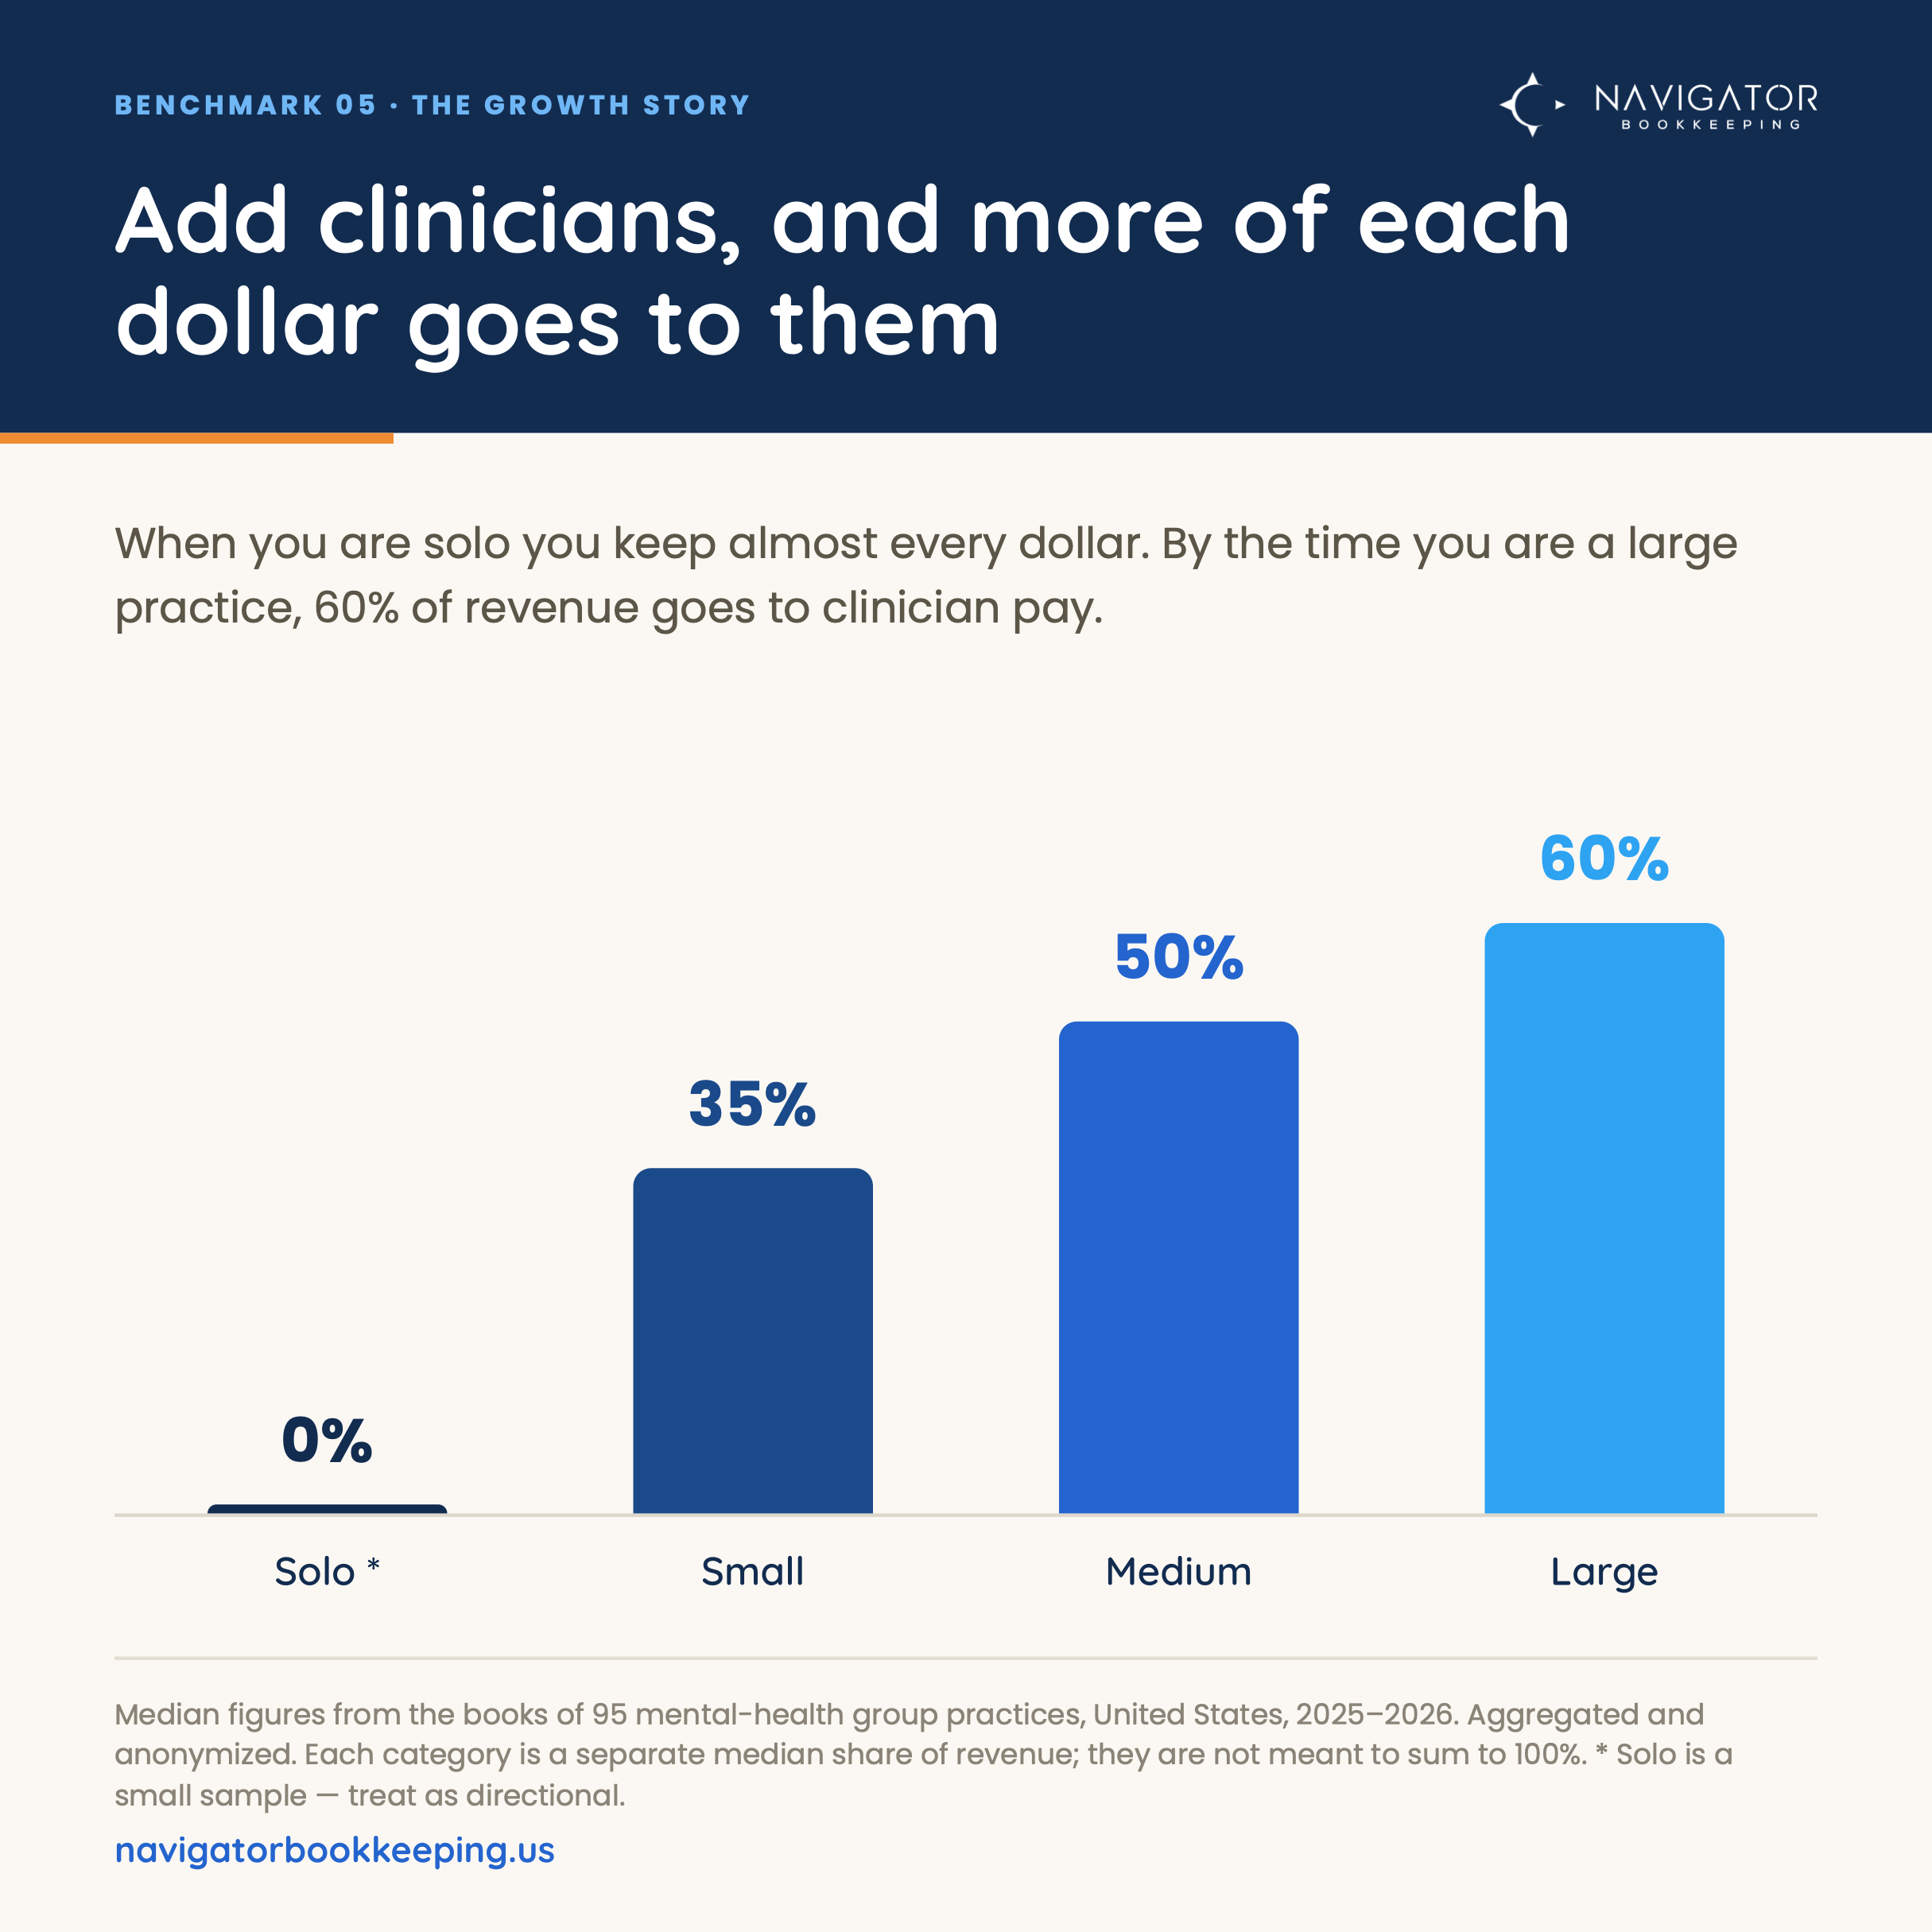
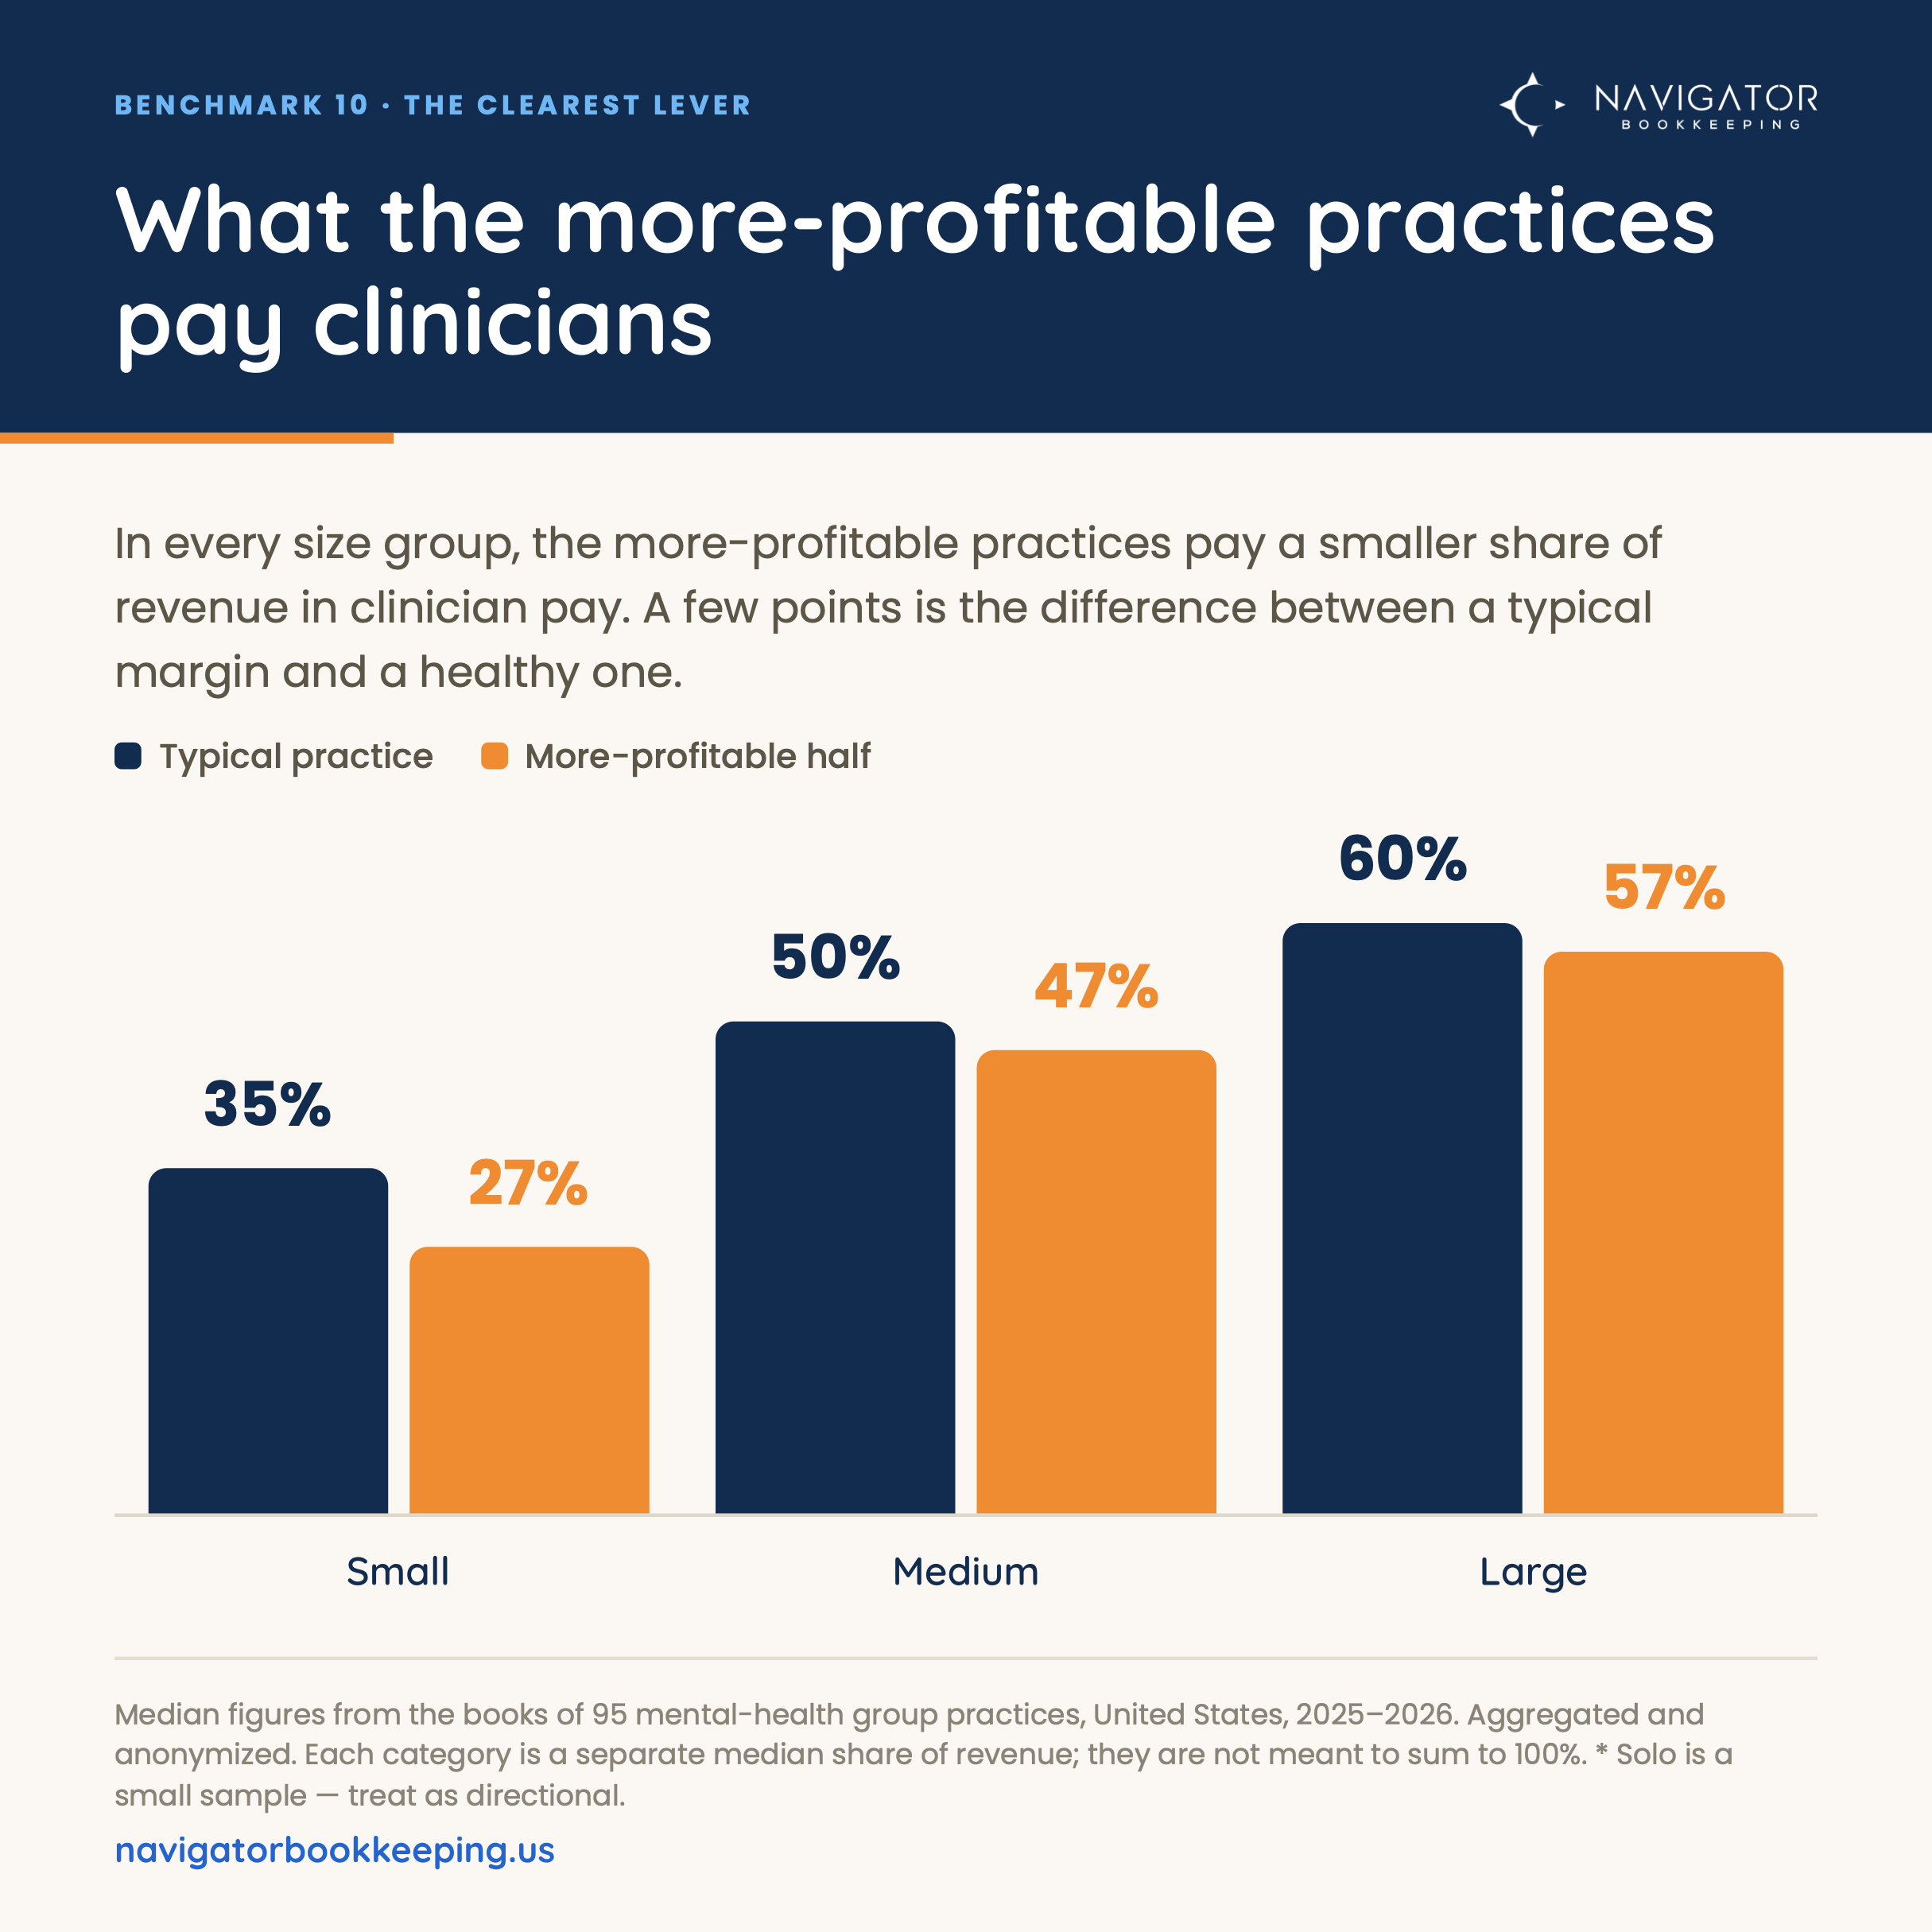
This is the single biggest number in almost every group practice. When you are solo it is near zero, because you are the clinician. As you build a team it climbs fast, and it sets the ceiling on what your practice can earn.
Each square is $1 of every $100 a large practice brings in.
At a large practice, 60 cents of every dollar goes to clinicians.
It's the cost that grows fastest as you hire, which makes it the first number to watch.
Clinician pay climbs with every hire
Clinician pay as a % of revenue, by practice size
top half 27%
top half 47%
top half 57%
Median figures. * Solo is the smallest group; treat as directional. Notice the more-profitable practices run a slightly lower clinician-pay share.
54% of revenue, about $432,000 a year on clinician pay. Typical for their size is 50%, with most between 46% and 56%. A touch above the middle, but comfortably normal. Above about 65% would be a flag that the split is too generous or rates are too low.
How to read yours
Find your size row and compare. Well above the range usually points to one of two things: a clinician split that is too generous, or reimbursement rates that are too low. Both are fixable.
What the strongest practices do
They keep clinician pay sustainable without underpaying. They know their exact split and revisit it as rates change, rather than setting it once and forgetting it.
How much overhead does a therapy practice carry?
In plain terms: operating expenses are all the costs of running the practice that are not clinician pay: rent, software, your EHR, admin staff, marketing. Often shortened to “OPEX” or just “overhead.”
Overhead is where owners most often fear they are overspending. The reassuring news: it stays steady in dollars as practices grow, so it falls as a share of revenue. It's clinician pay and profit that swing.
Overhead takes half of a solo practice's revenue, and a quarter of a large one's.
Growing spreads the same fixed costs over far more revenue.
Overhead shrinks as a share of revenue as you grow
Operating expenses as a % of revenue, by practice size
top half 27%
top half 40%
top half 25%
top half 24%
Median figures. * Solo is the smallest group; treat as directional. Overhead moves less than the other numbers, so the gap to the more-profitable half is small.
28% of revenue, about $224,000 a year. Typical for their size is 28%, most between 23% and 31%. Right on the money. Nothing to change.
How to read yours
Compare your row to the range. If you're notably high, the smaller line items break overhead into rent, admin and marketing, so you can find which piece is running hot.
What the strongest practices do
They don't obsess over trimming overhead. They keep it steady and predictable, and spend their energy on the two levers that move profit: clinician pay and revenue per clinician.
What’s a good profit margin for a therapy group practice?
In plain terms: net profit margin is the share of every dollar of revenue left after all expenses are paid. A 15% margin means 15 cents of every dollar is profit.
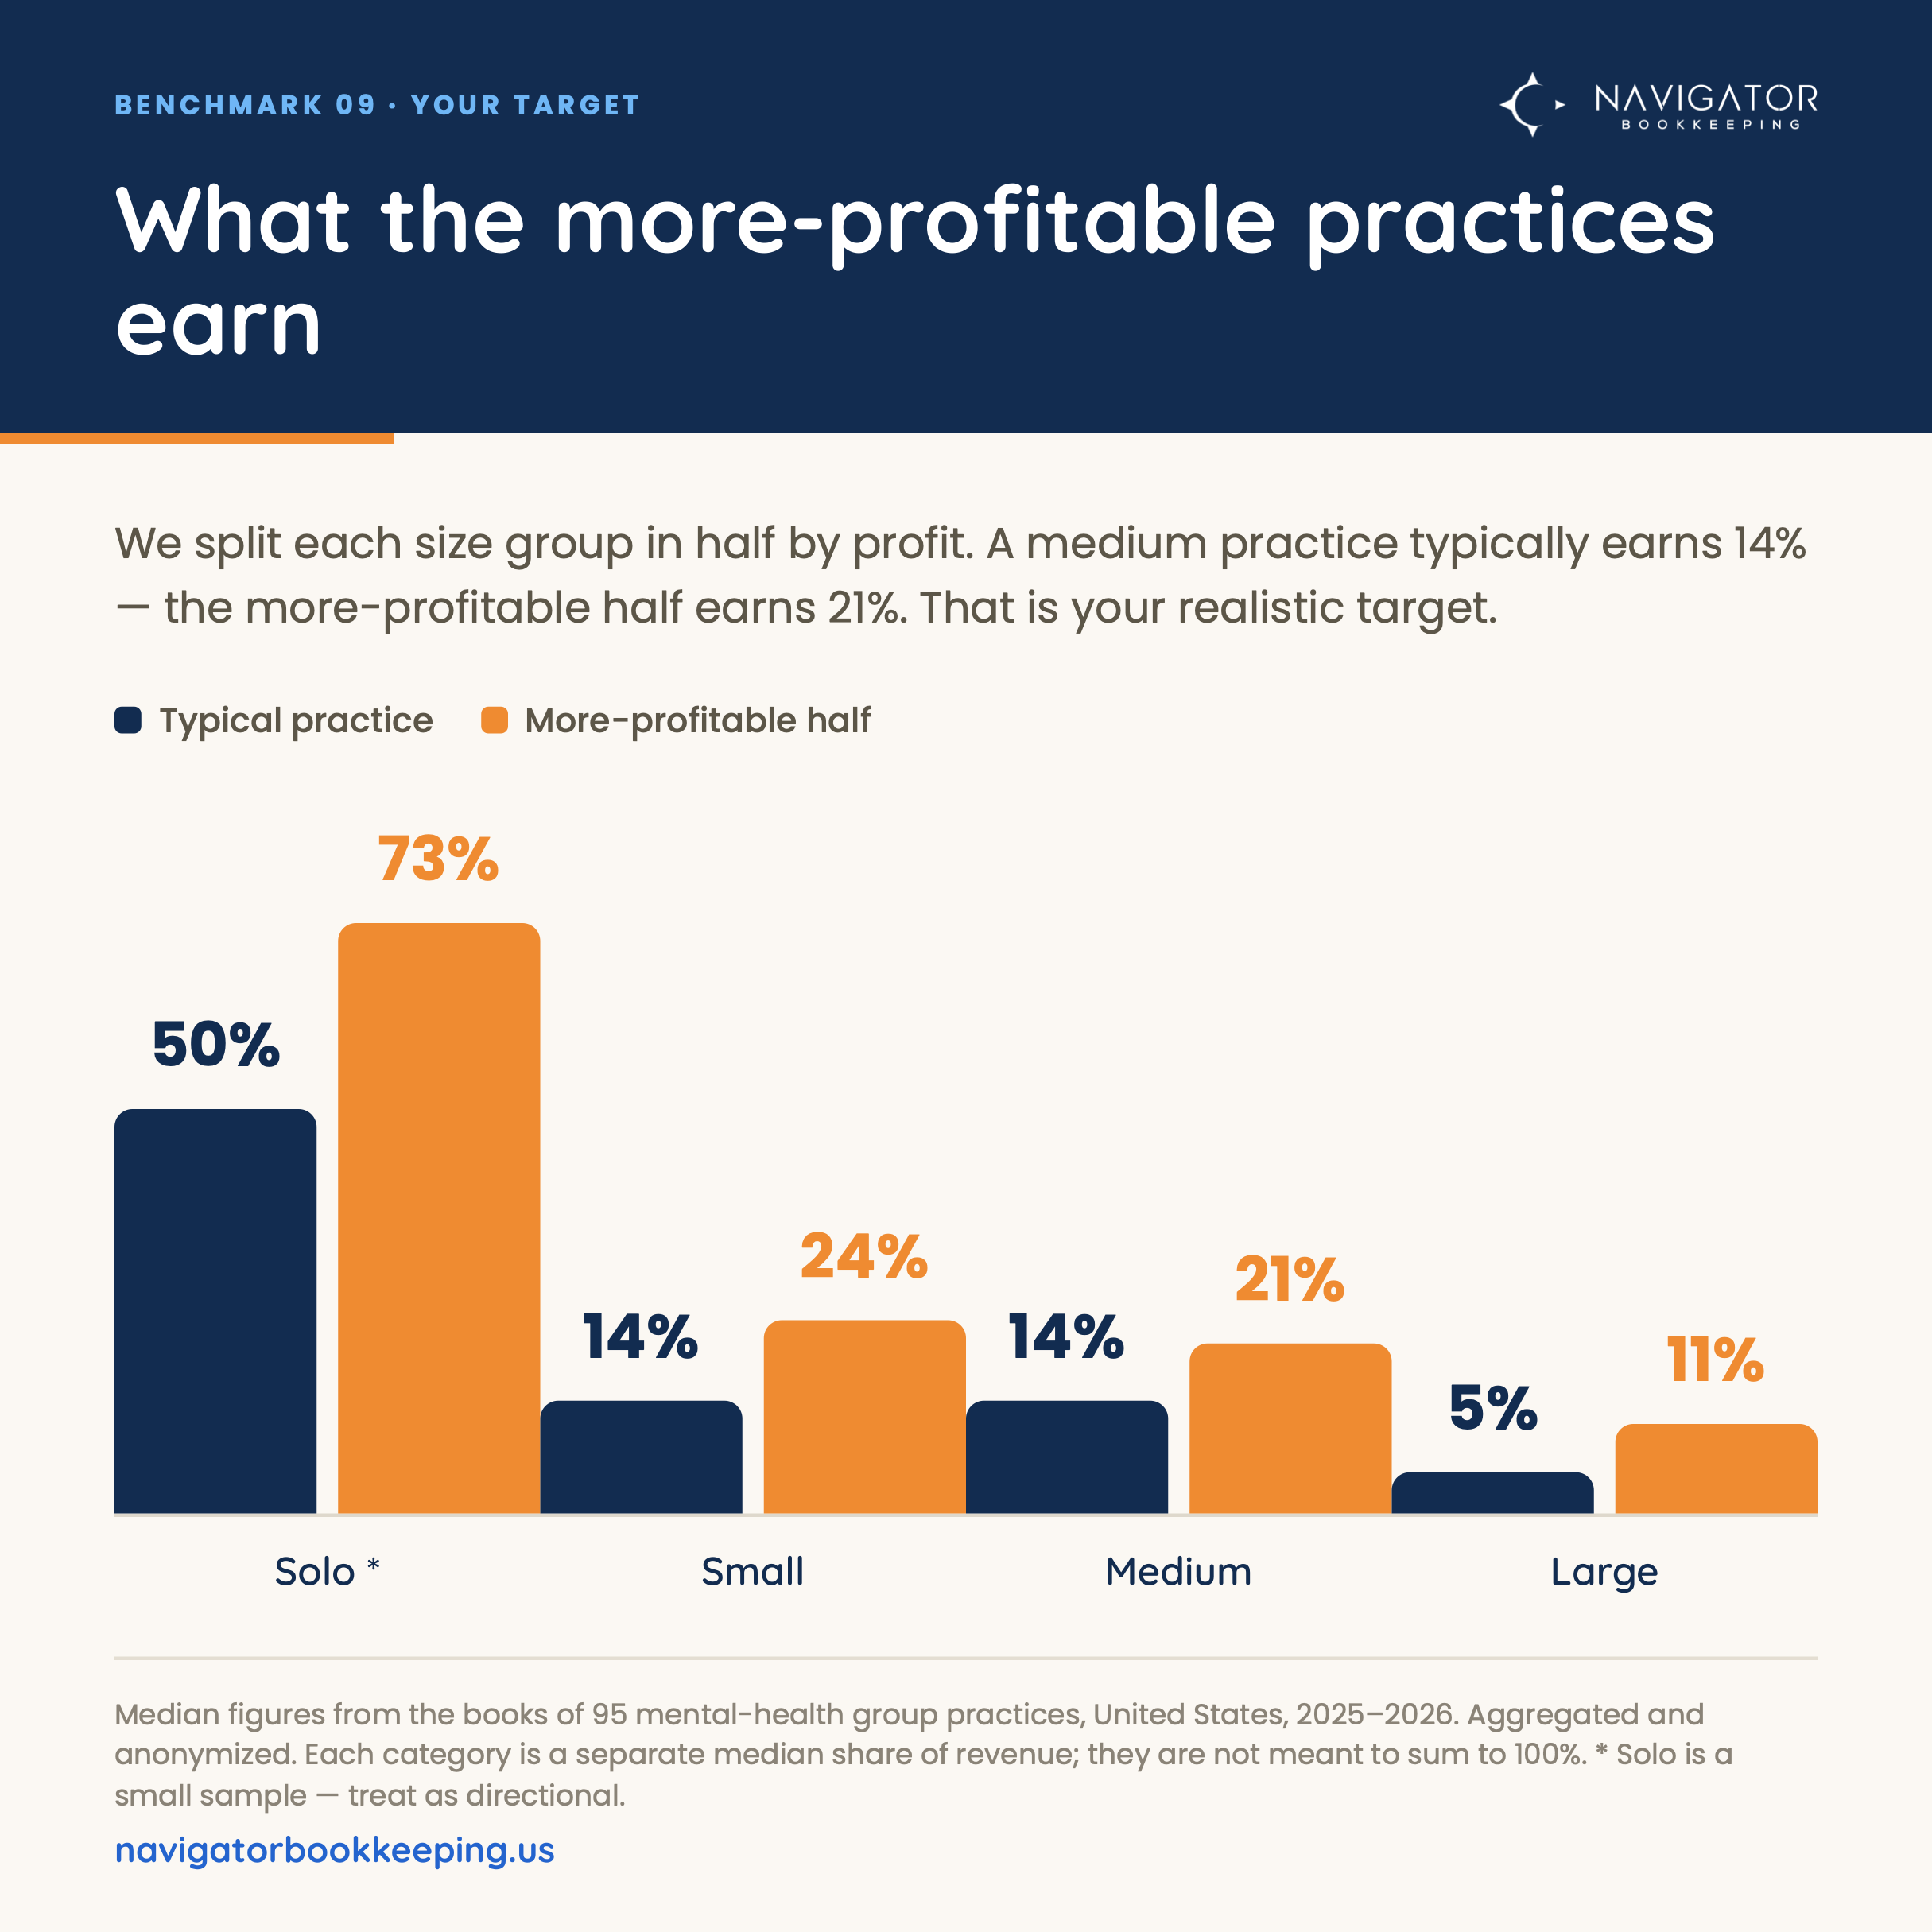
Profit margin is the clearest single measure of financial health, and the number most owners have never benchmarked. The right target depends entirely on your size. Owners who compare themselves to a solo practice's margin feel like they're failing, when they're scaling exactly as they should.
Each square is $1 of every $100. The orange ones are profit.
A 14% margin is healthy for a small or medium practice.
The more-profitable half runs about 7 to 10 points higher at every size. Use their number as your target.
Margins get thinner as practices grow
Net profit margin as a % of revenue, by practice size
top half 73%
top half 24%
top half 21%
top half 11%
Median figures. * Solo is the smallest group; treat as directional.
15% net margin, about $120,000 in profit. Typical for their size is 14%, most between 4% and 21%. Squarely healthy, and it's normal for margin to be tighter than in the solo days.
How to read yours
Margins compress as you grow. Solo practices run high margins because the owner is the clinician. By the time you're large and paying a full team, high single digits is normal. Compare yourself to your size, never to a solo.
What the strongest practices do
They protect margin by watching clinician pay as a share of revenue and keeping clinicians productively booked, not by cutting overhead to the bone.
How much do group practice owners pay themselves?
In plain terms: owner's pay is what you pay yourself for your own work, your wages or owner's draw, separate from any profit the business keeps.
It's often the fuzziest number in a practice, and the one owners most want to compare. The data gives a clear answer that changes with size, and reveals a pattern almost no one expects.
Owners take a smaller share as they grow, but a much bigger paycheck.
Typical owner's pay rises from $74K at $250–500K revenue to $202K above $1M, even as the percentage falls from 20% to 11%.
Owner's pay falls as a share of revenue
Owner's pay as a % of revenue, by practice size
top half 52%
top half 31%
top half 21%
top half 15%
Median figures. * Solo is the smallest group; treat as directional. The more-profitable practices also pay their owners a higher share: profit and owner pay rise together.
In dollars, owner's pay rises with revenue
Annual owner's pay, by practice revenue
most $54K–$106K
most $75K–$177K
most $165K–$294K
19% of revenue, about $152,000 a year to the owner. Typical for their size is 19%, most between 12% and 26%. Right in line for a medium practice.
How to read yours
Check both the percentage and the dollars. A solo owner may take 40% or more of a smaller revenue; a large-practice owner takes a smaller percentage of a much bigger number, and usually earns more in real dollars.
What the strongest practices do
Strong owners pay themselves deliberately, a defined amount the business can sustain, rather than taking whatever is left over. That steadies both their income and the practice's cash flow.
Where the rest of the money goes, how payer mix and pay model change the picture, and what really happens to your numbers as you grow.
Rent, admin pay and marketing: the smaller line items
Beyond clinician pay and the owner's take, a practice's money flows into a few predictable places. “7% rent” means 7 cents of every dollar you bring in goes to rent.
Rent and occupancy · most 4–9%. Scales with your footprint; fully remote practices run near zero.
Admin payroll · most 2–7%. Front-desk and admin staff. Solo practices often carry none.
Marketing · most 1–4%. Lean across the board; most growth here is referral-driven.
Software and EHR costs together typically run about 3% of revenue. Outsourced billing and separate leadership pay were reported by too few practices to publish reliably, so we left them out rather than give you a number we don't trust.
Insurance vs. private pay: how the numbers differ
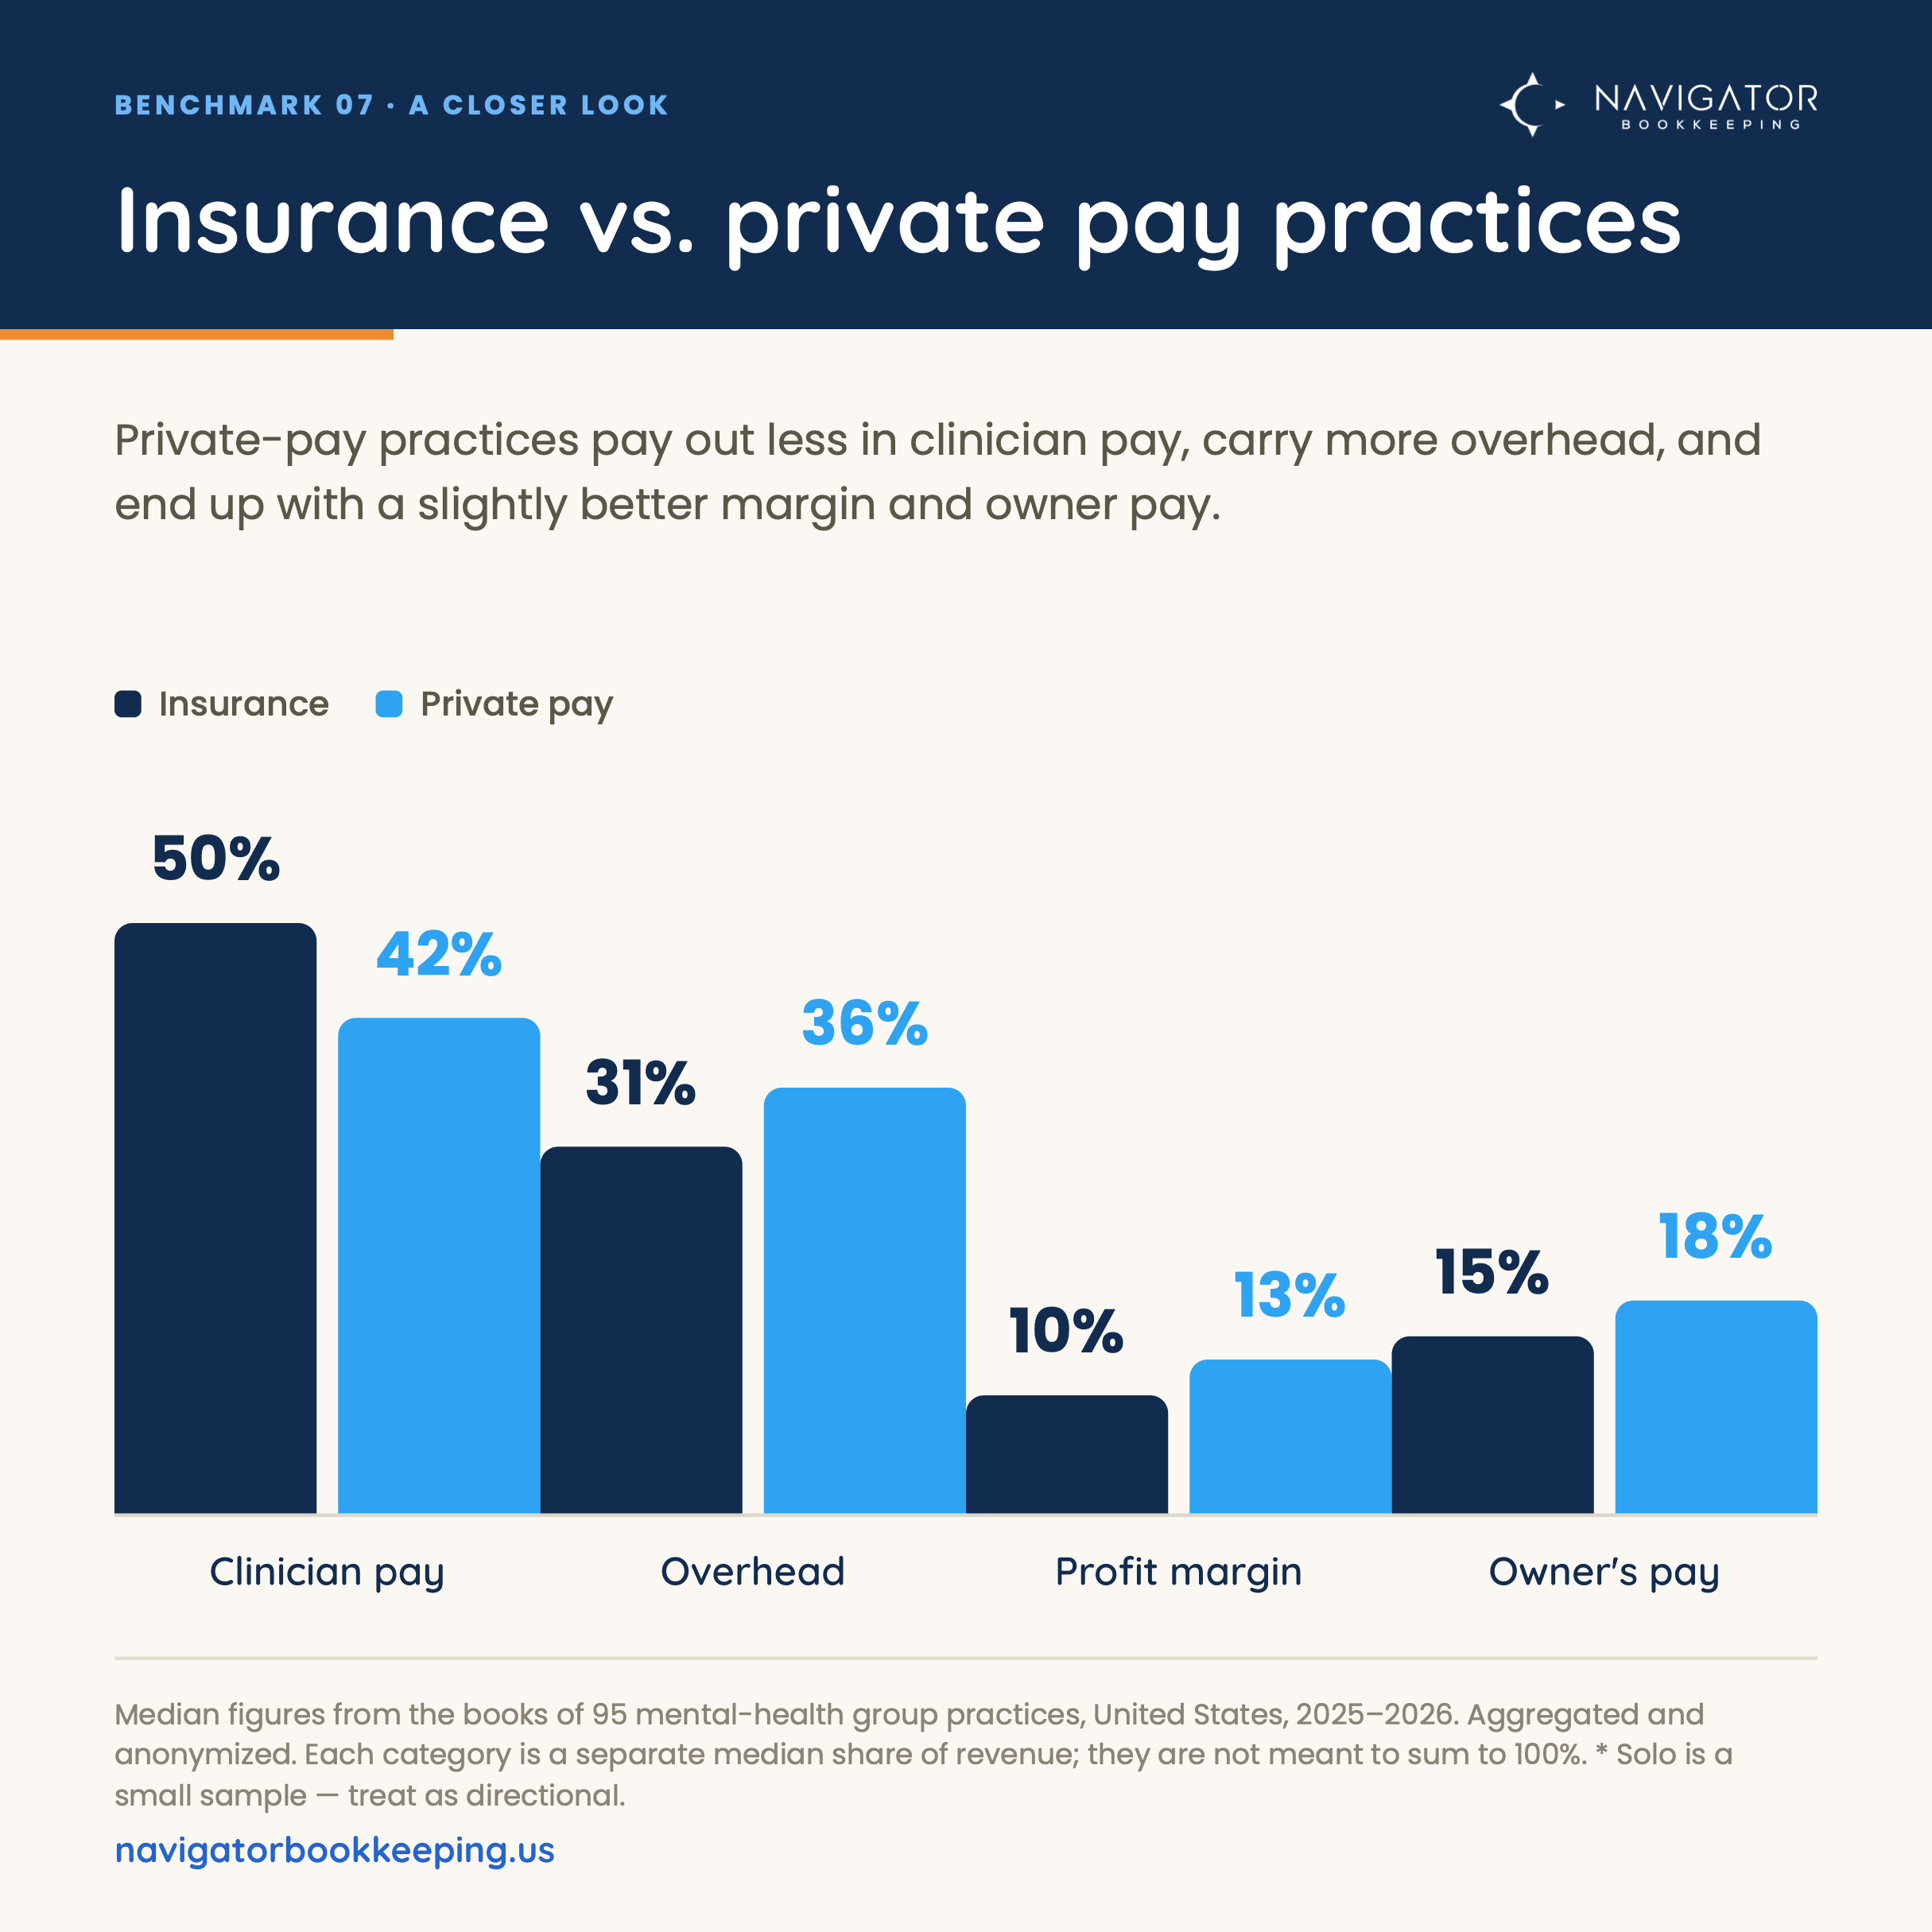
Whether you bill insurance or clients pay out of pocket shapes your whole financial picture. Private-pay practices pay out less to clinicians, carry more overhead, and end up with a slightly better margin and owner's pay.
Private pay shifts money from clinician pay to overhead and profit
Median % of revenue, all sizes combined
If you're a private-pay practice, the private-pay bars are your benchmark, not the overall figures elsewhere in this guide.
Percentage split vs. hourly pay for clinicians
Percentage split or hourly rate is one of the biggest structural choices an owner makes, and one almost no benchmark report has measured.
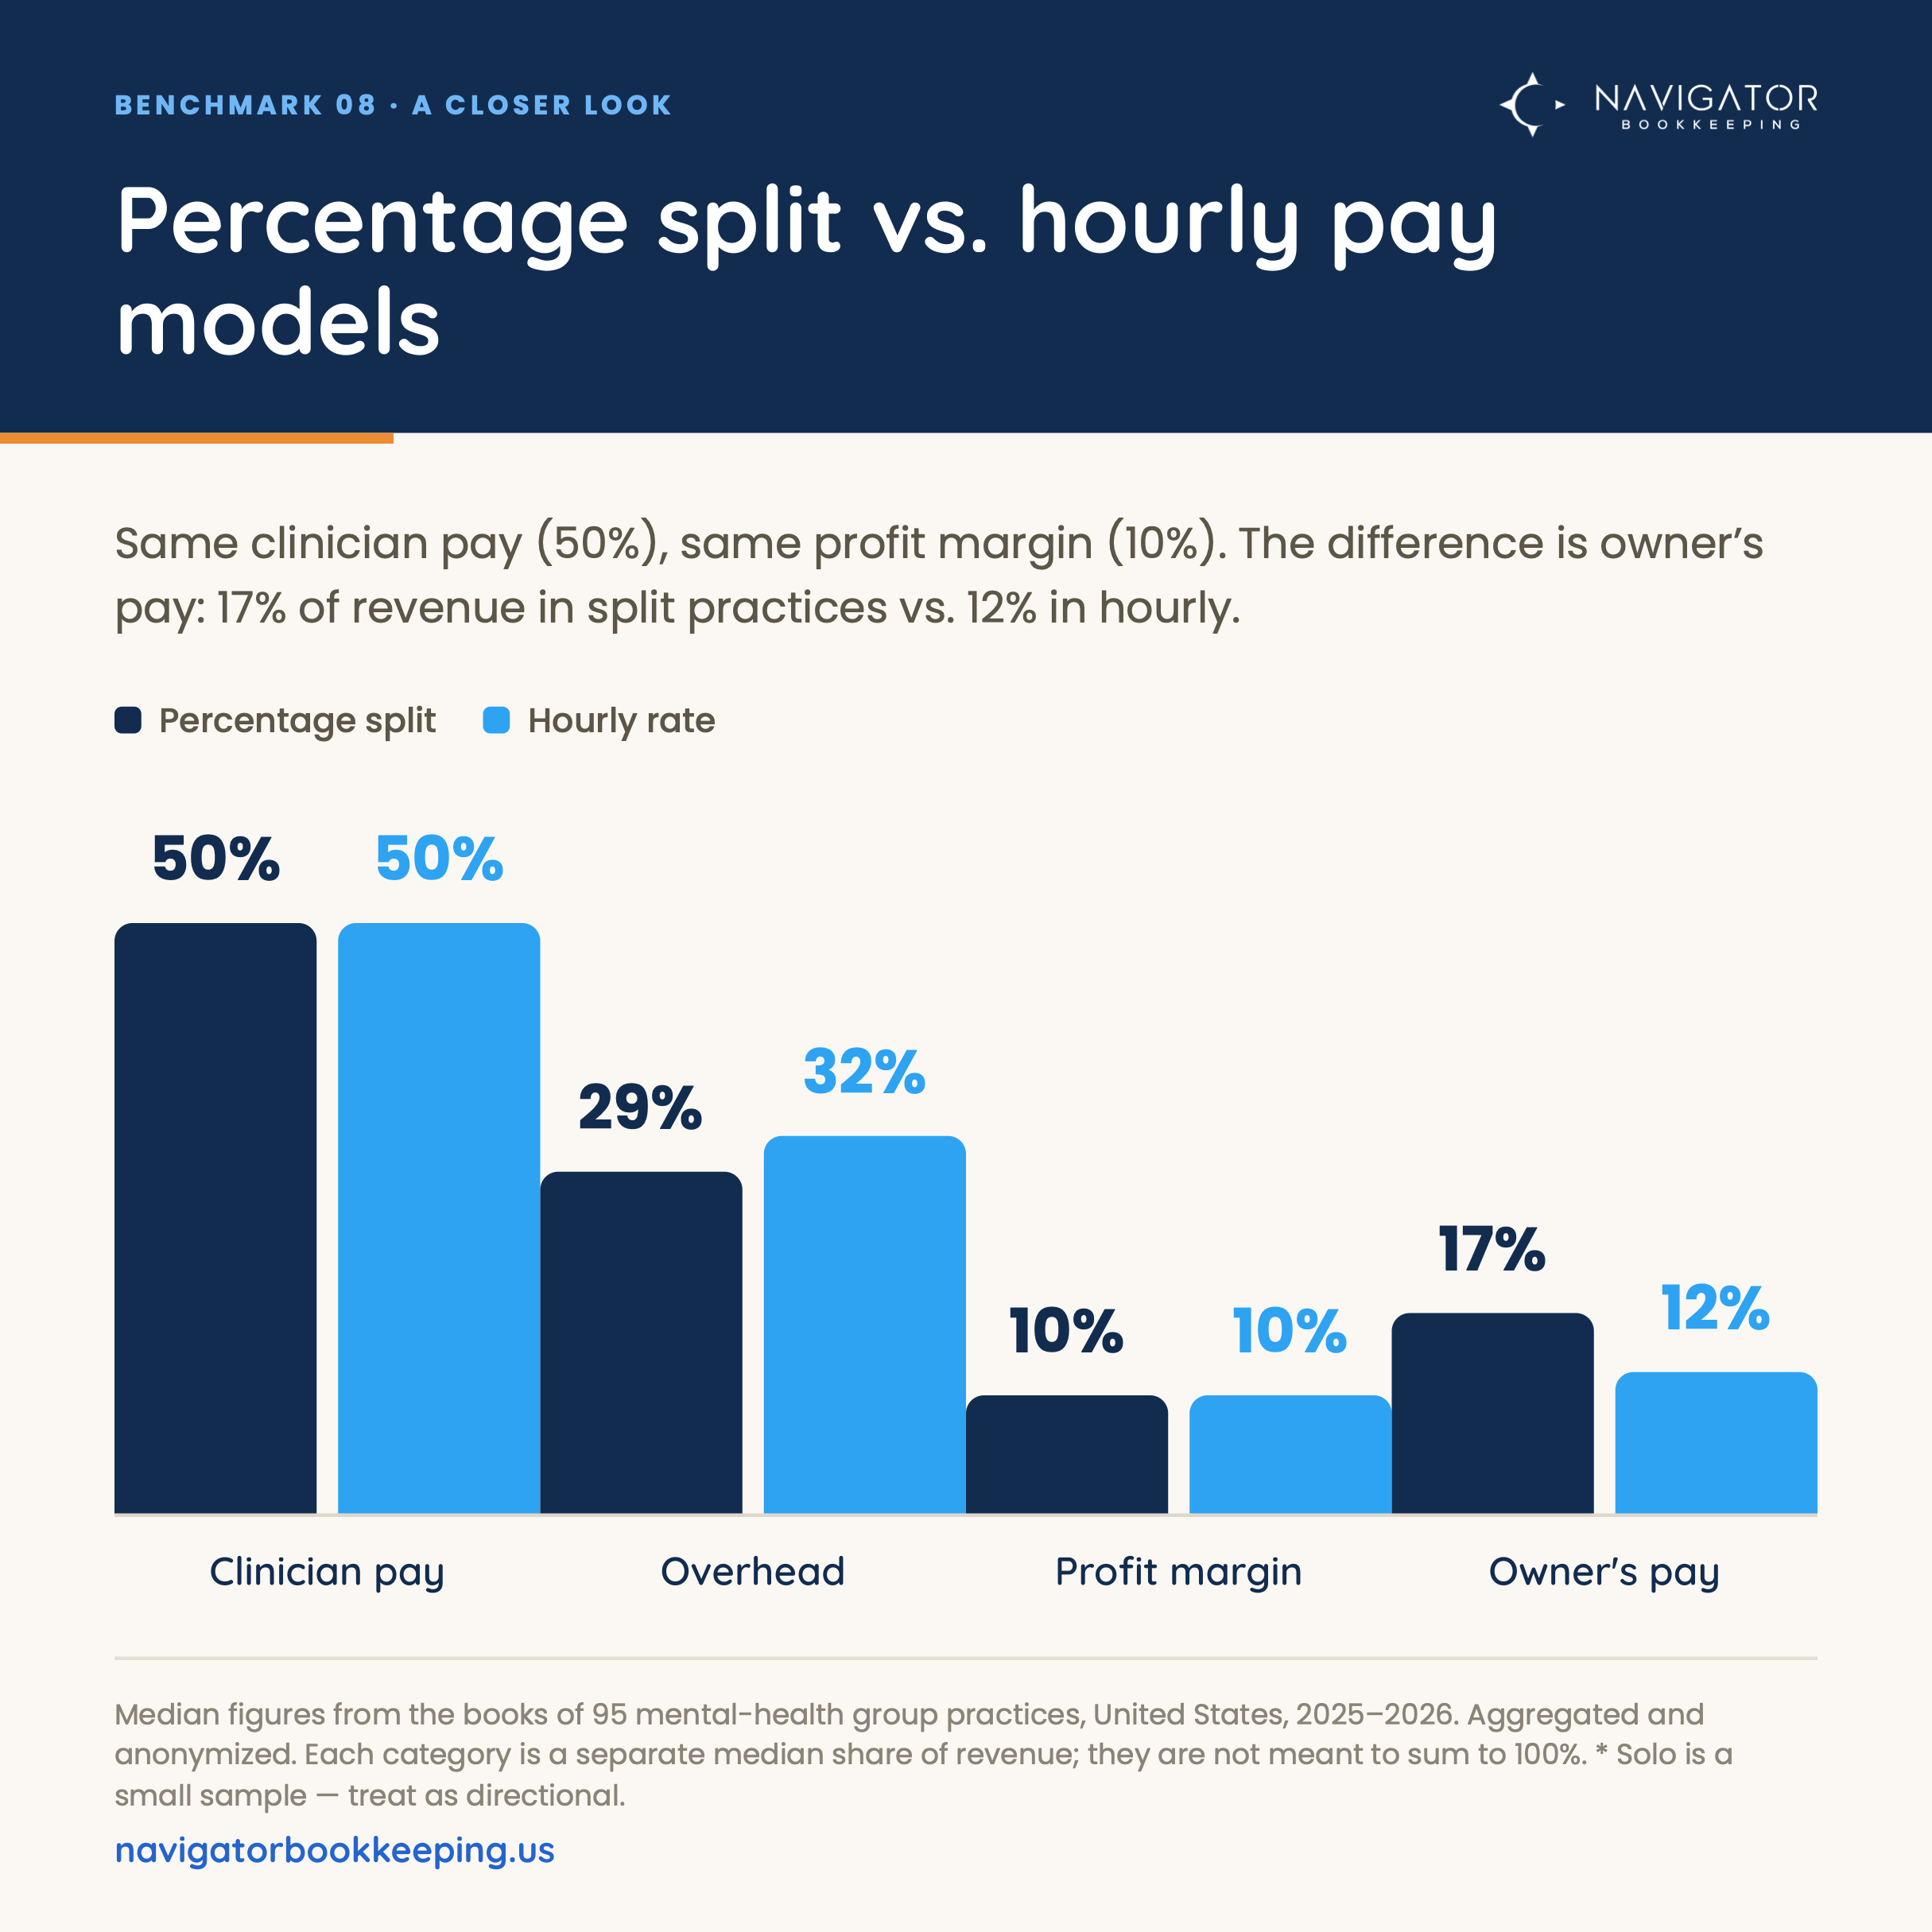
Split and hourly practices look the same, except for the owner's paycheck.
Both pay clinicians 50% of revenue and land at a 10% margin. Owners of percentage-split practices take about 17% of revenue, versus 12% in hourly practices.
The only real gap is owner's pay
Median % of revenue, all sizes combined
Beyond owner's pay, the model you choose is less about efficiency and more about fit: predictability for you versus upside-sharing for your clinicians. Salaried practices appear too rarely to benchmark; we mention them only as an observation.
What happens to profit as a therapy practice grows
The single most useful thing this report can tell you is what happens to your numbers as you add clinicians. It explains why growing can feel like running to stand still, and why that's normal.
As clinician pay rises, margin falls
Median % of revenue, by practice size
* Solo is a small sample; treat as directional.
- As you add clinicians, more of each dollar goes to paying them. A solo owner keeps almost every dollar. The moment you hire, part of each dollar goes out as clinician pay.
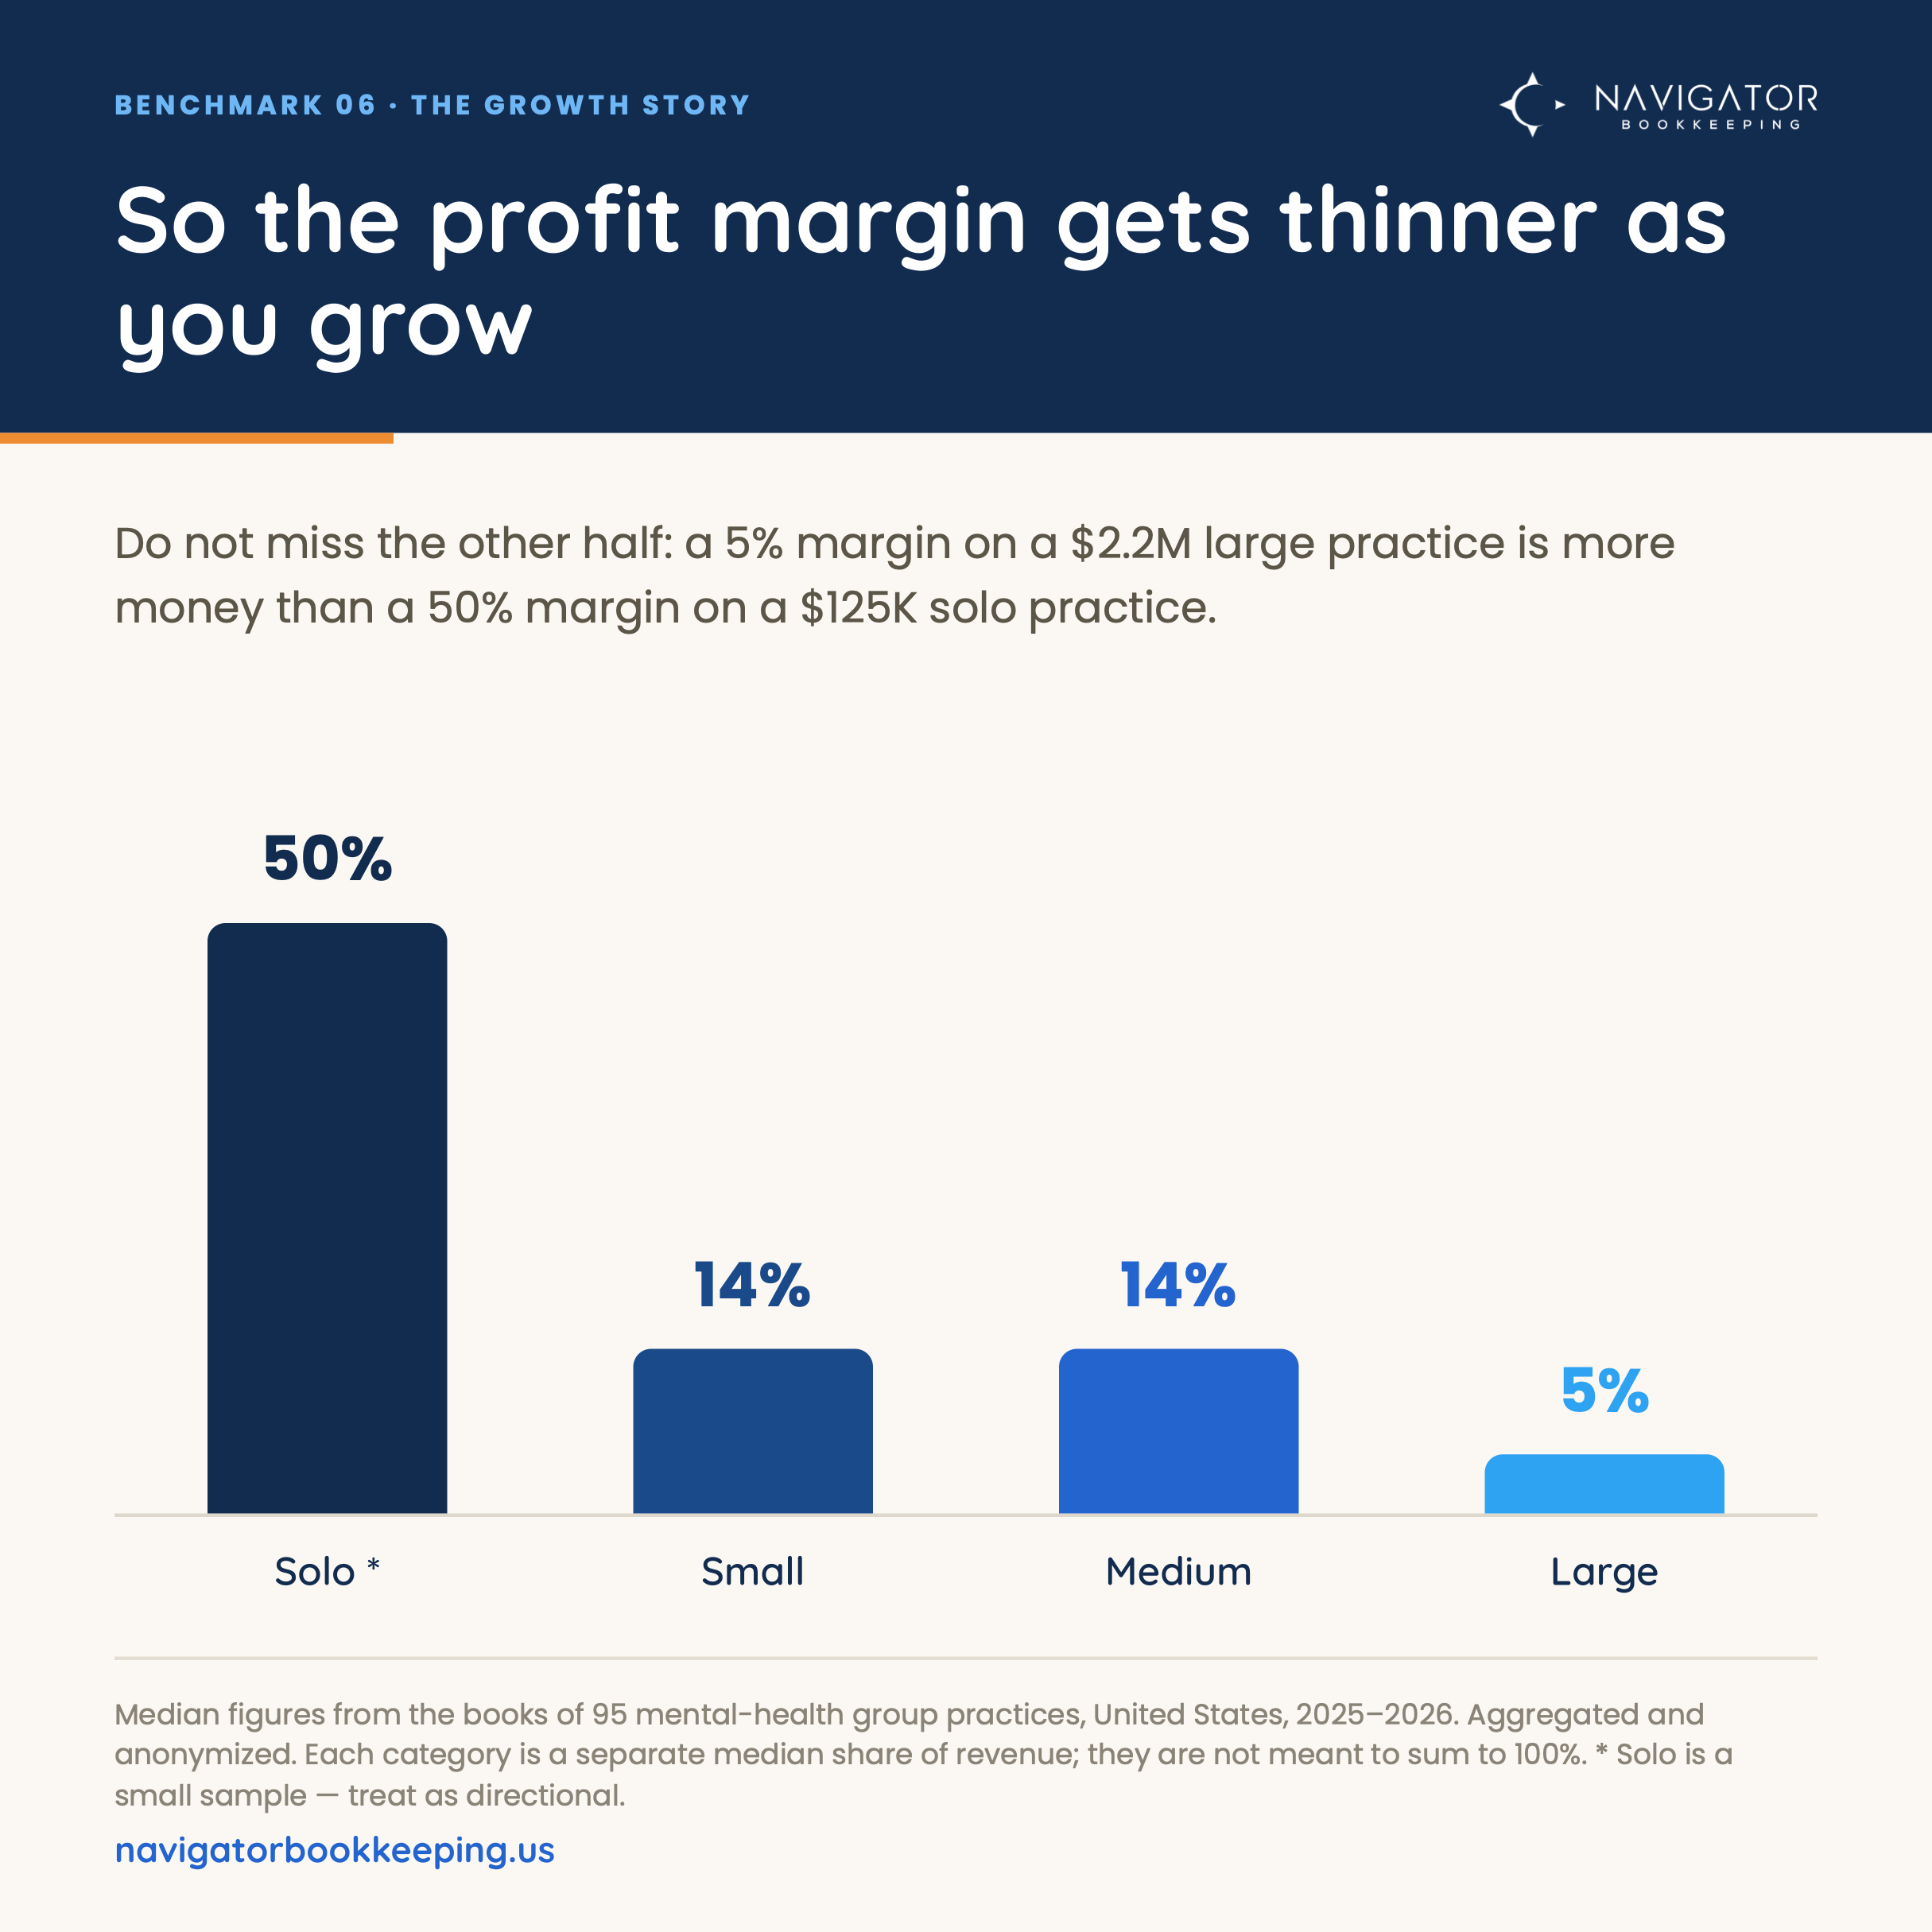
- So the profit margin gets thinner. A solo practice keeps a big slice of a small pie; a large group keeps a thin slice of a much bigger pie.
A thin slice of a big pie beats a big slice of a small one
Each circle is sized by typical annual revenue. The orange slice is profit.
Falling margin isn't failure; it's the shape of growth. Practices that scale well expect it, and grow revenue fast enough that the smaller slice is still a bigger number.
How to hold these benchmarks up against your own books, and a calculator that does the math for you.
How to benchmark your own practice
A benchmark only helps if you can hold it up against your own practice. Here's the simple way to do that, even if you've never felt like a “numbers person.”
Start with revenue
Find your total revenue for the year. Every benchmark here is a share of it.
Turn costs into percentages
Divide each cost by revenue: clinician pay ÷ revenue, overhead ÷ revenue, and so on.
Find your size, read across
Your numbers only mean something next to practices like yours. Use your size row throughout.
Look for the outliers
You don't need to match every benchmark. The one or two figures far outside the range are where the real opportunities live.
Or skip the math: the calculator below does steps 2 and 3 for you.
Therapy practice benchmark calculator
Enter your annual numbers from last year's profit and loss statement. Your results update as you type, and nothing you enter leaves this page.
Your numbers vs. the 2026 benchmarks
We've filled in Navigator Counseling's example numbers. Replace them with yours.
If you'd like help reading your own story
This report is a gift from Navigator Bookkeeping. We meet monthly with mental-health practice owners across the country to help them understand the numbers behind their practice, in plain language.
The plain-English glossary, and exactly how we built these numbers.
The words we use
Nobody teaches you these terms in grad school, so here they are in plain English. Each one is also explained where it appears above.
- Revenue
- All the money your practice takes in before any costs are paid. The top line.
- Cost of services (COS)
- What you pay clinicians to see clients. Sometimes called “cost of goods sold.” It does not include your own pay.
- Operating expenses (OPEX)
- Everything else it takes to run the practice: rent, software, EHR, admin staff, marketing. Also called “overhead.”
- Net profit
- What is left after every expense is paid. The bottom line.
- Net profit margin
- Net profit as a share of revenue. A 15% margin means 15 cents of every dollar is profit.
- Owner's pay
- What you pay yourself for your work, your wages or draw, separate from profit the business keeps.
- Revenue per clinician
- Total revenue divided by how many clinicians you have. A quick read on how busy the team is.
- Typical (the middle)
- The middle practice in the group: half are higher, half are lower. We use this instead of an average so one giant practice can't skew it.
- The range
- The band most practices fall within (the middle half). If you land inside it, you are normal.
- The more-profitable half
- Within each size group, the half of practices with the healthier profit margin. A realistic target to aim for.
How we built this report
A benchmark is only worth as much as the honesty behind it. Here's exactly what these numbers are, and what they are not.
Where the data comes from
Navigator Bookkeeping meets monthly with mental-health practice owners to help them understand their numbers. Because every practice we work with is on a consistent set of books closed each month, we can compare them fairly. We included practices with at least six months of data in a single year; most had a full year, and a handful had a partial year whose annual dollar figures are scaled to a full-year estimate (their percentages are unaffected).
How we report the numbers
Every figure is a median, the true middle of the group, never an average, because one unusually large practice can badly distort an average. Alongside the middle, we show the range most practices fall within (the middle half). We never publish a breakdown built on too few practices without flagging it; the solo tier is the smallest group and is labeled as a small sample throughout.
What “the more-profitable half” means
Within each size group we split practices at the middle profit margin and take the healthier half. It answers a better question than “what is average?” by showing what the practices that are actually making money look like.
What “cost of services” means here
Cost of services is what a practice pays its clinicians to deliver care. It does not include the owner's own pay, rent, software or admin staff; those live in operating expenses. Every practice in this report classifies these the same way.
A note on the math: the big categories won't add up to exactly 100% of revenue. Each figure is the median for its own category, calculated separately, and medians don't add together the way one practice's books do. Owner's pay is also counted inside overhead, so adding it on top counts it twice. Read each benchmark on its own (“what share of revenue goes to X”).
The one limit worth stating out loud
Every practice here chose to work with a professional financial guide, which likely makes this group a little more financially organized than average. These numbers describe practices that invested in their books: a strong benchmark to aim for, but worth remembering as you compare.
The Therapy Practice Benchmark Report, 2026 Edition. Aggregated and anonymized; no individual practice can be identified. Every figure is a median.